
2023 Career &
Salary Survey

Survey: Surgical volumes surge in midst of staffing woes
By Cynthia Saver

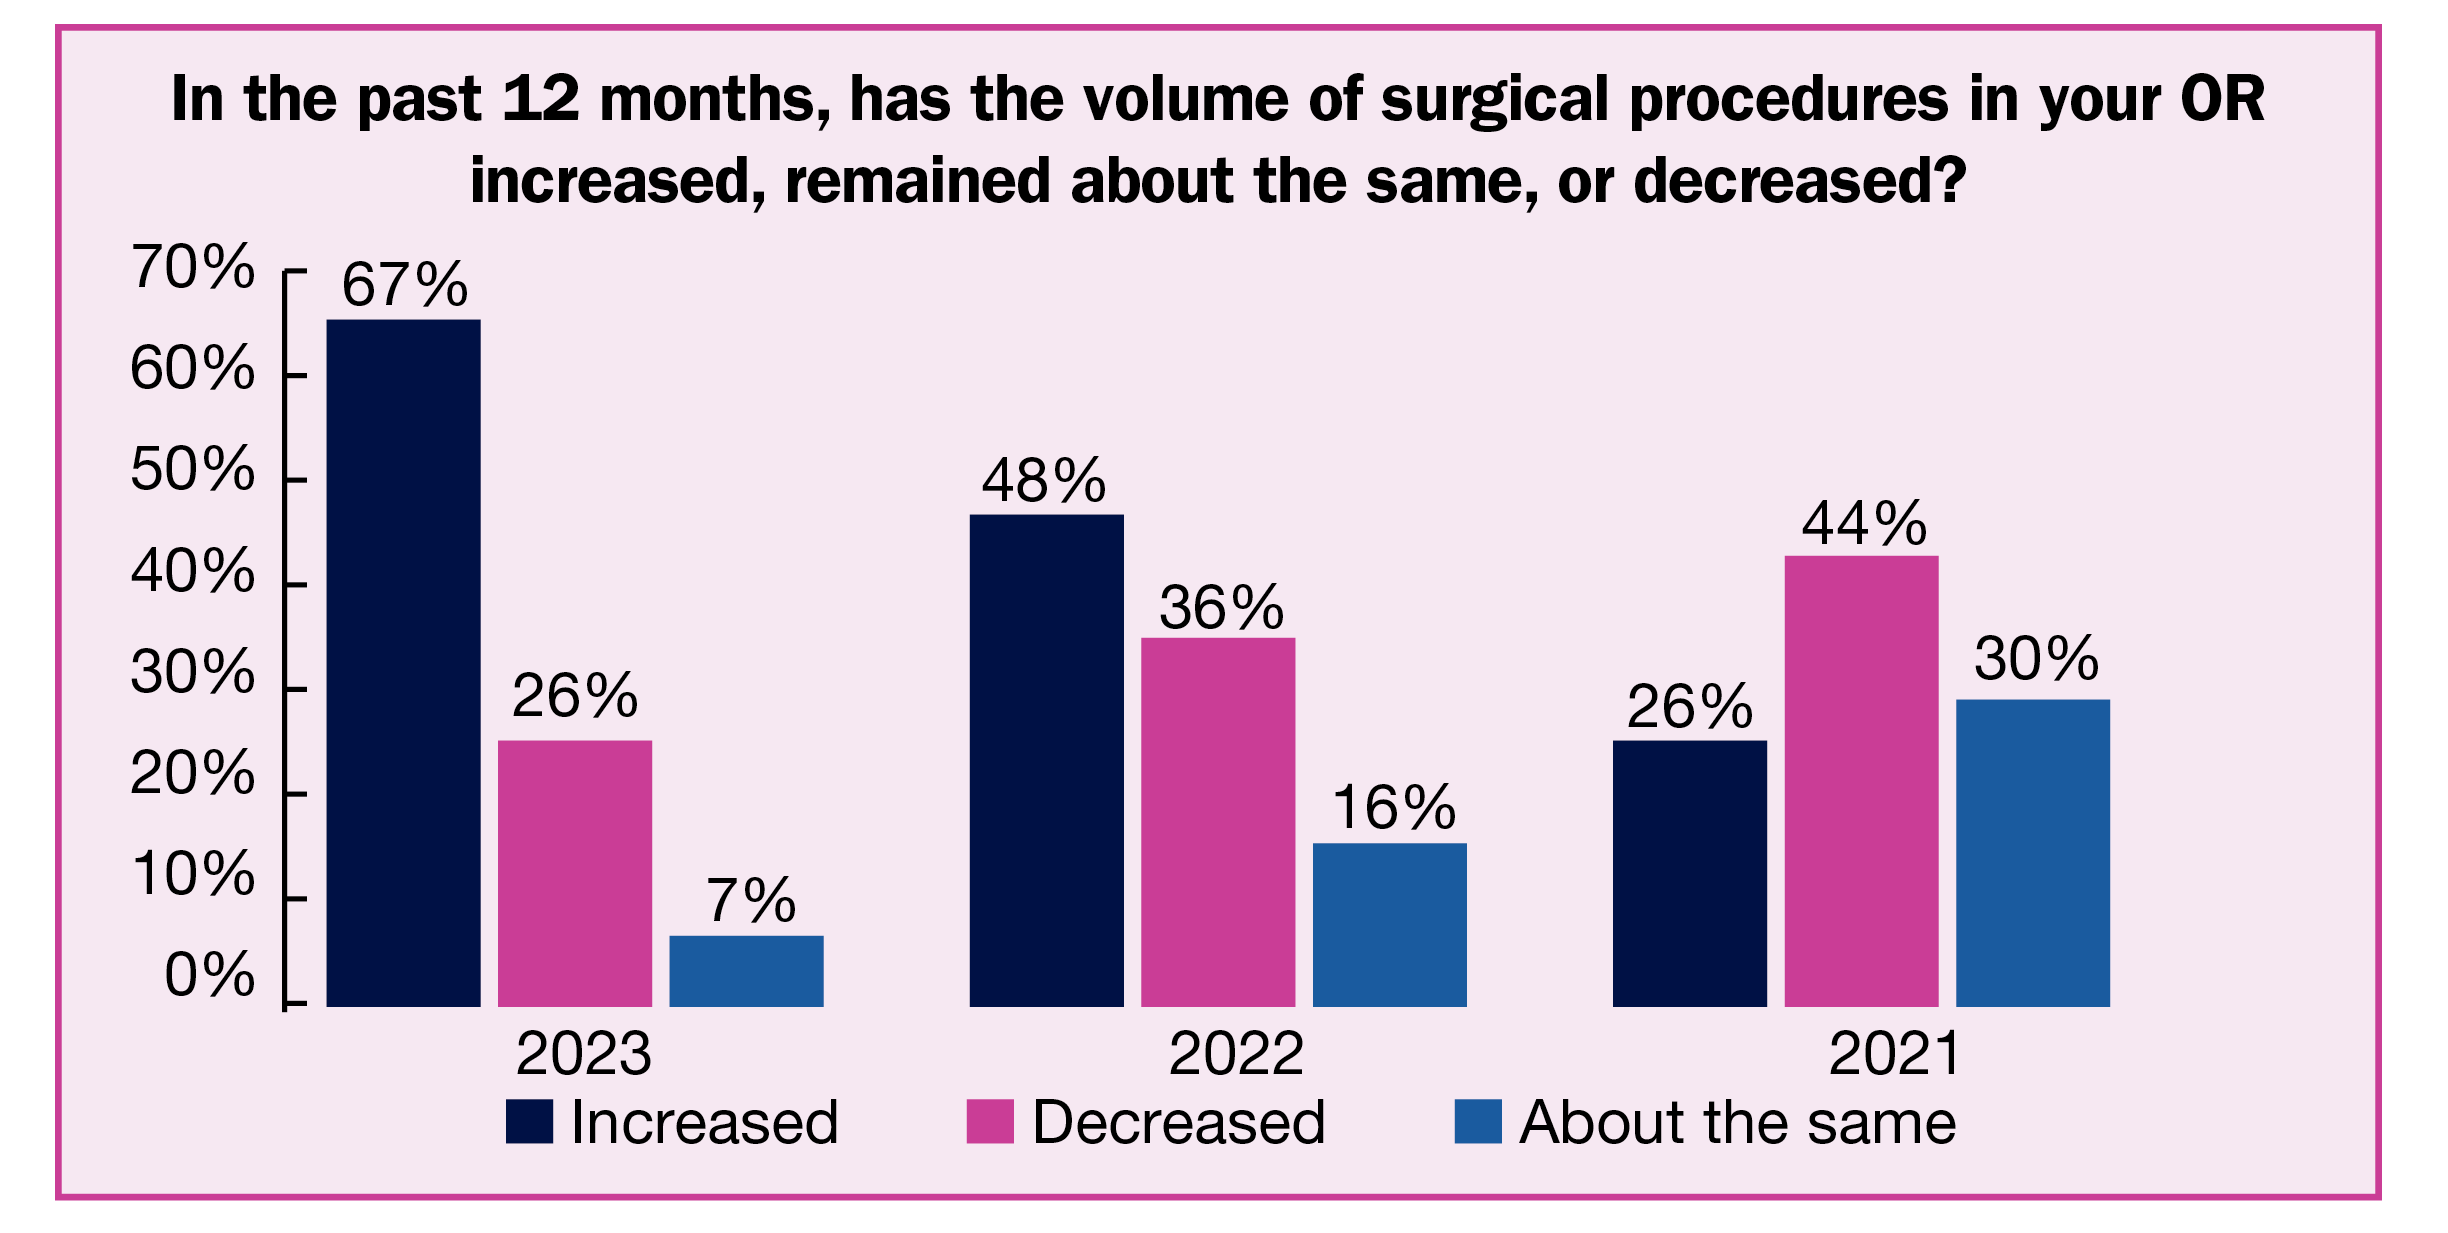
As COVID-19 becomes an endemic rather than pandemic force, surgical volume is surging, according to the 2023 OR Manager Salary/Career Survey. More than two-thirds (67%) of respondents reported increased volume over the past 12 months, up significantly from 48% last year.
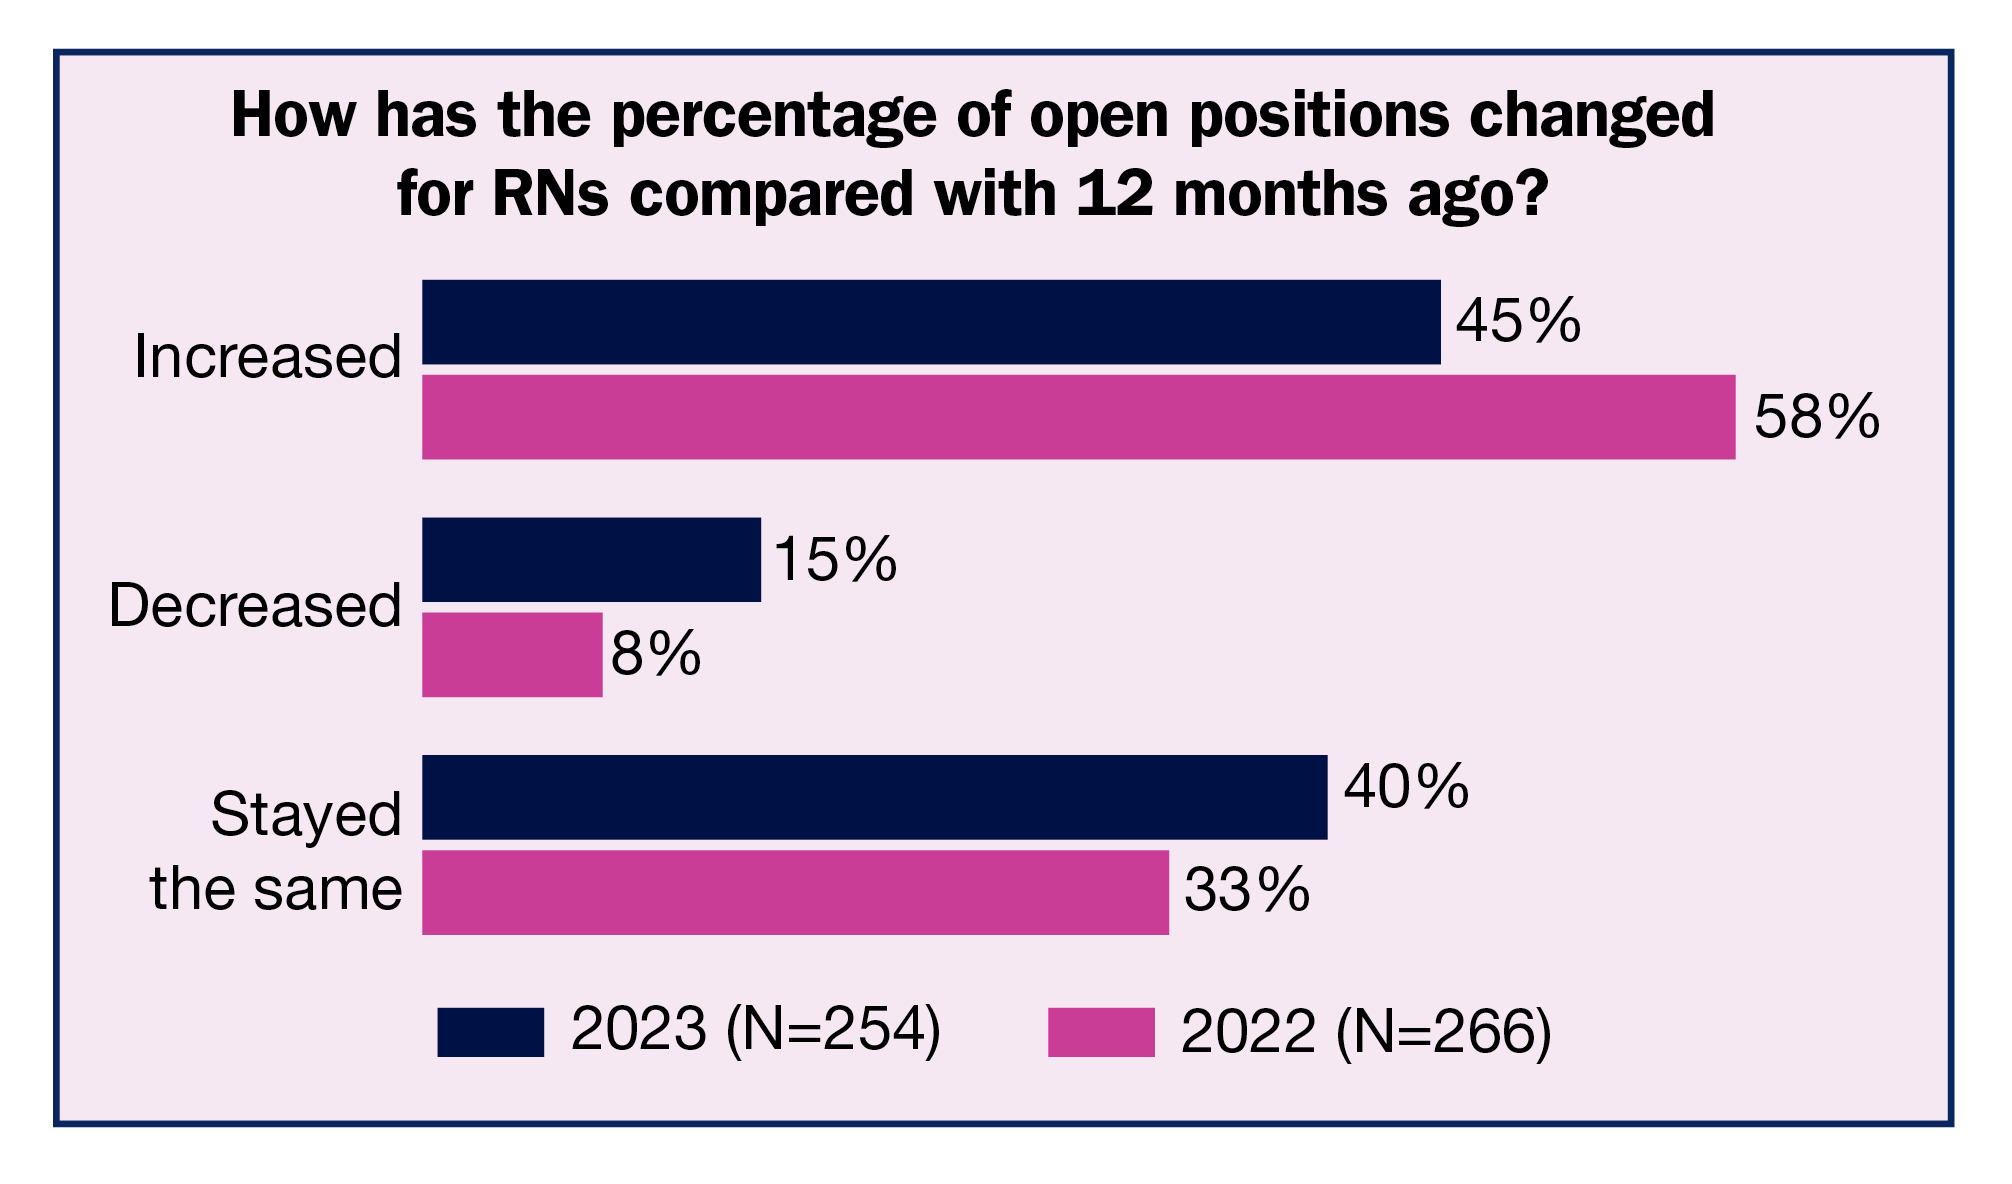
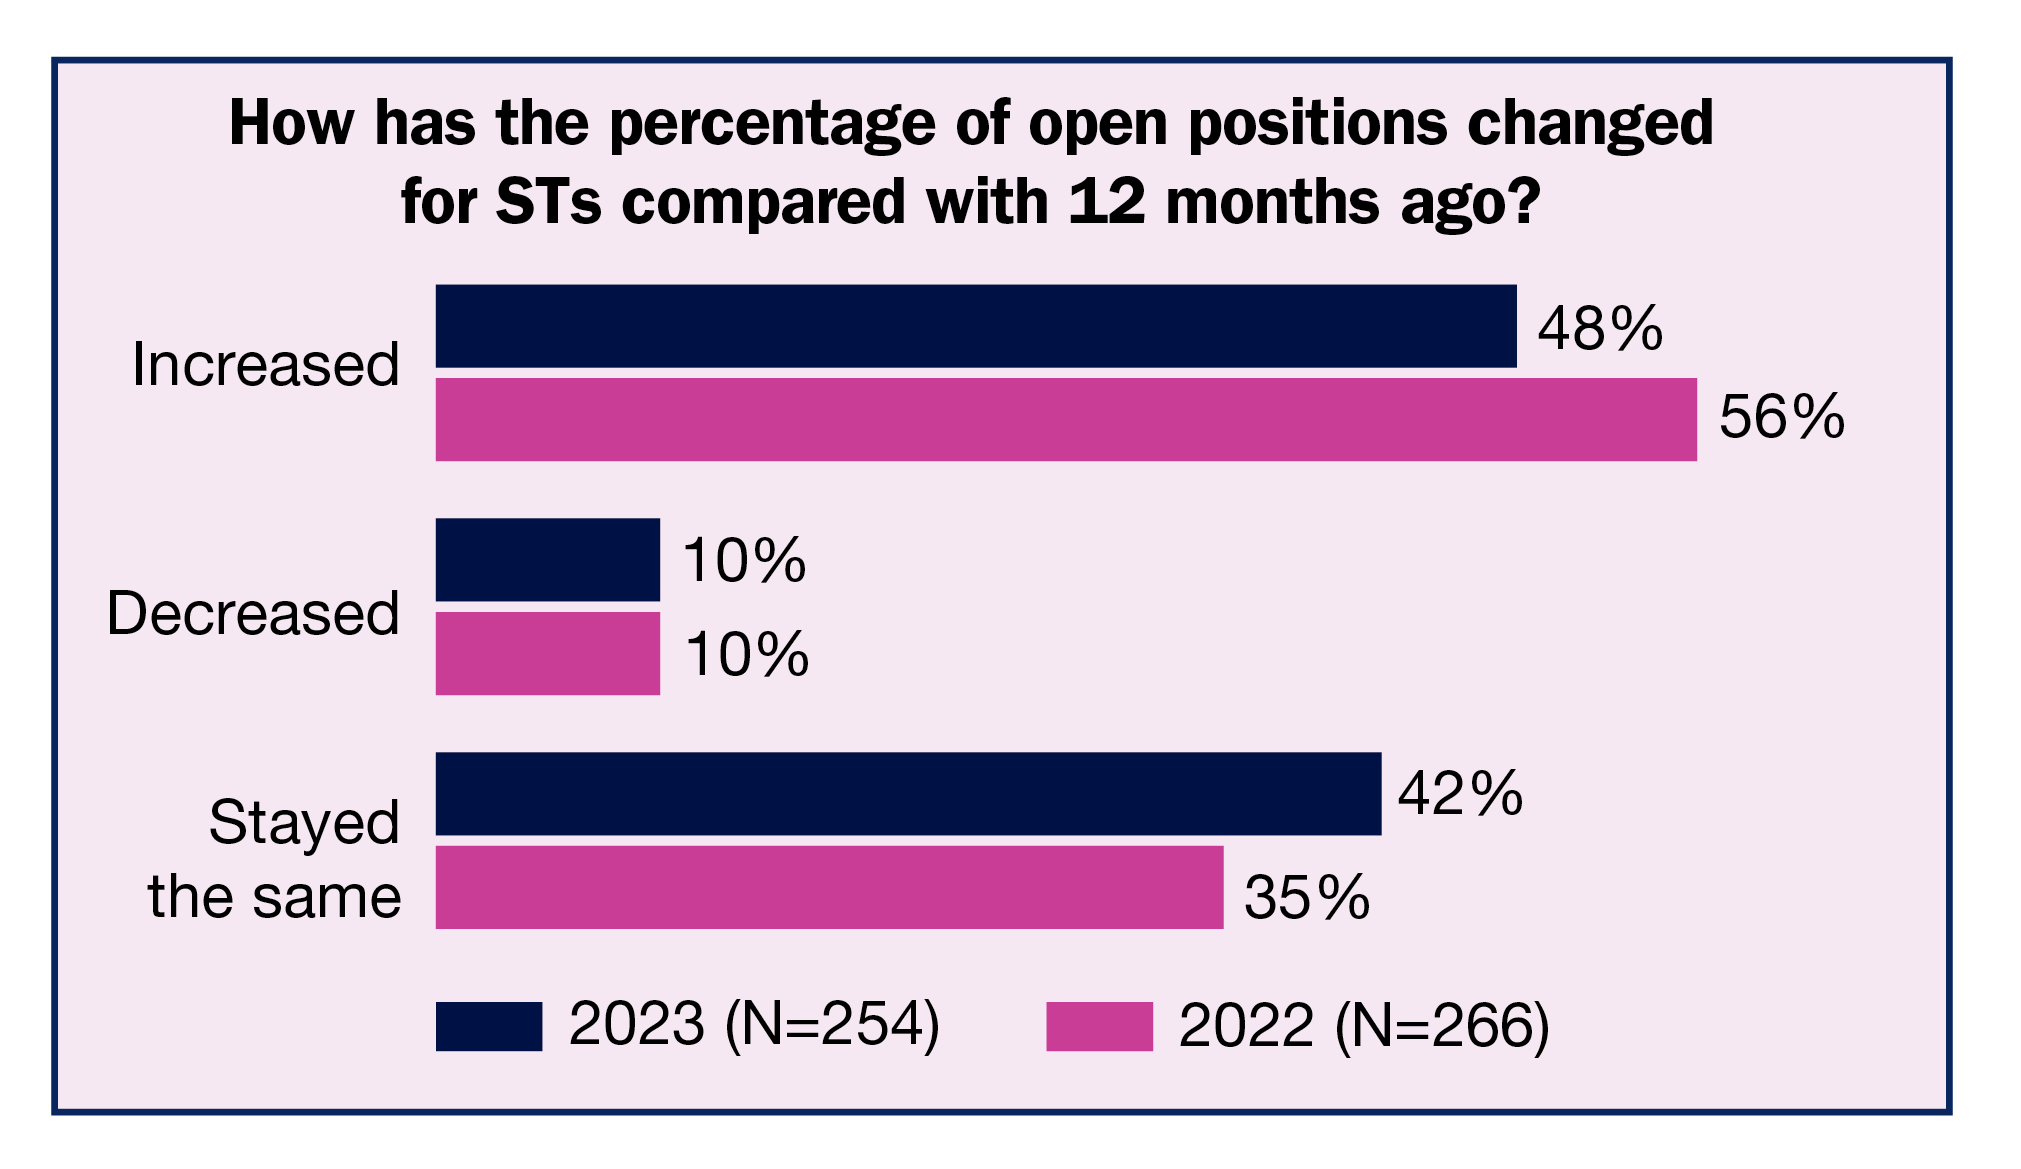
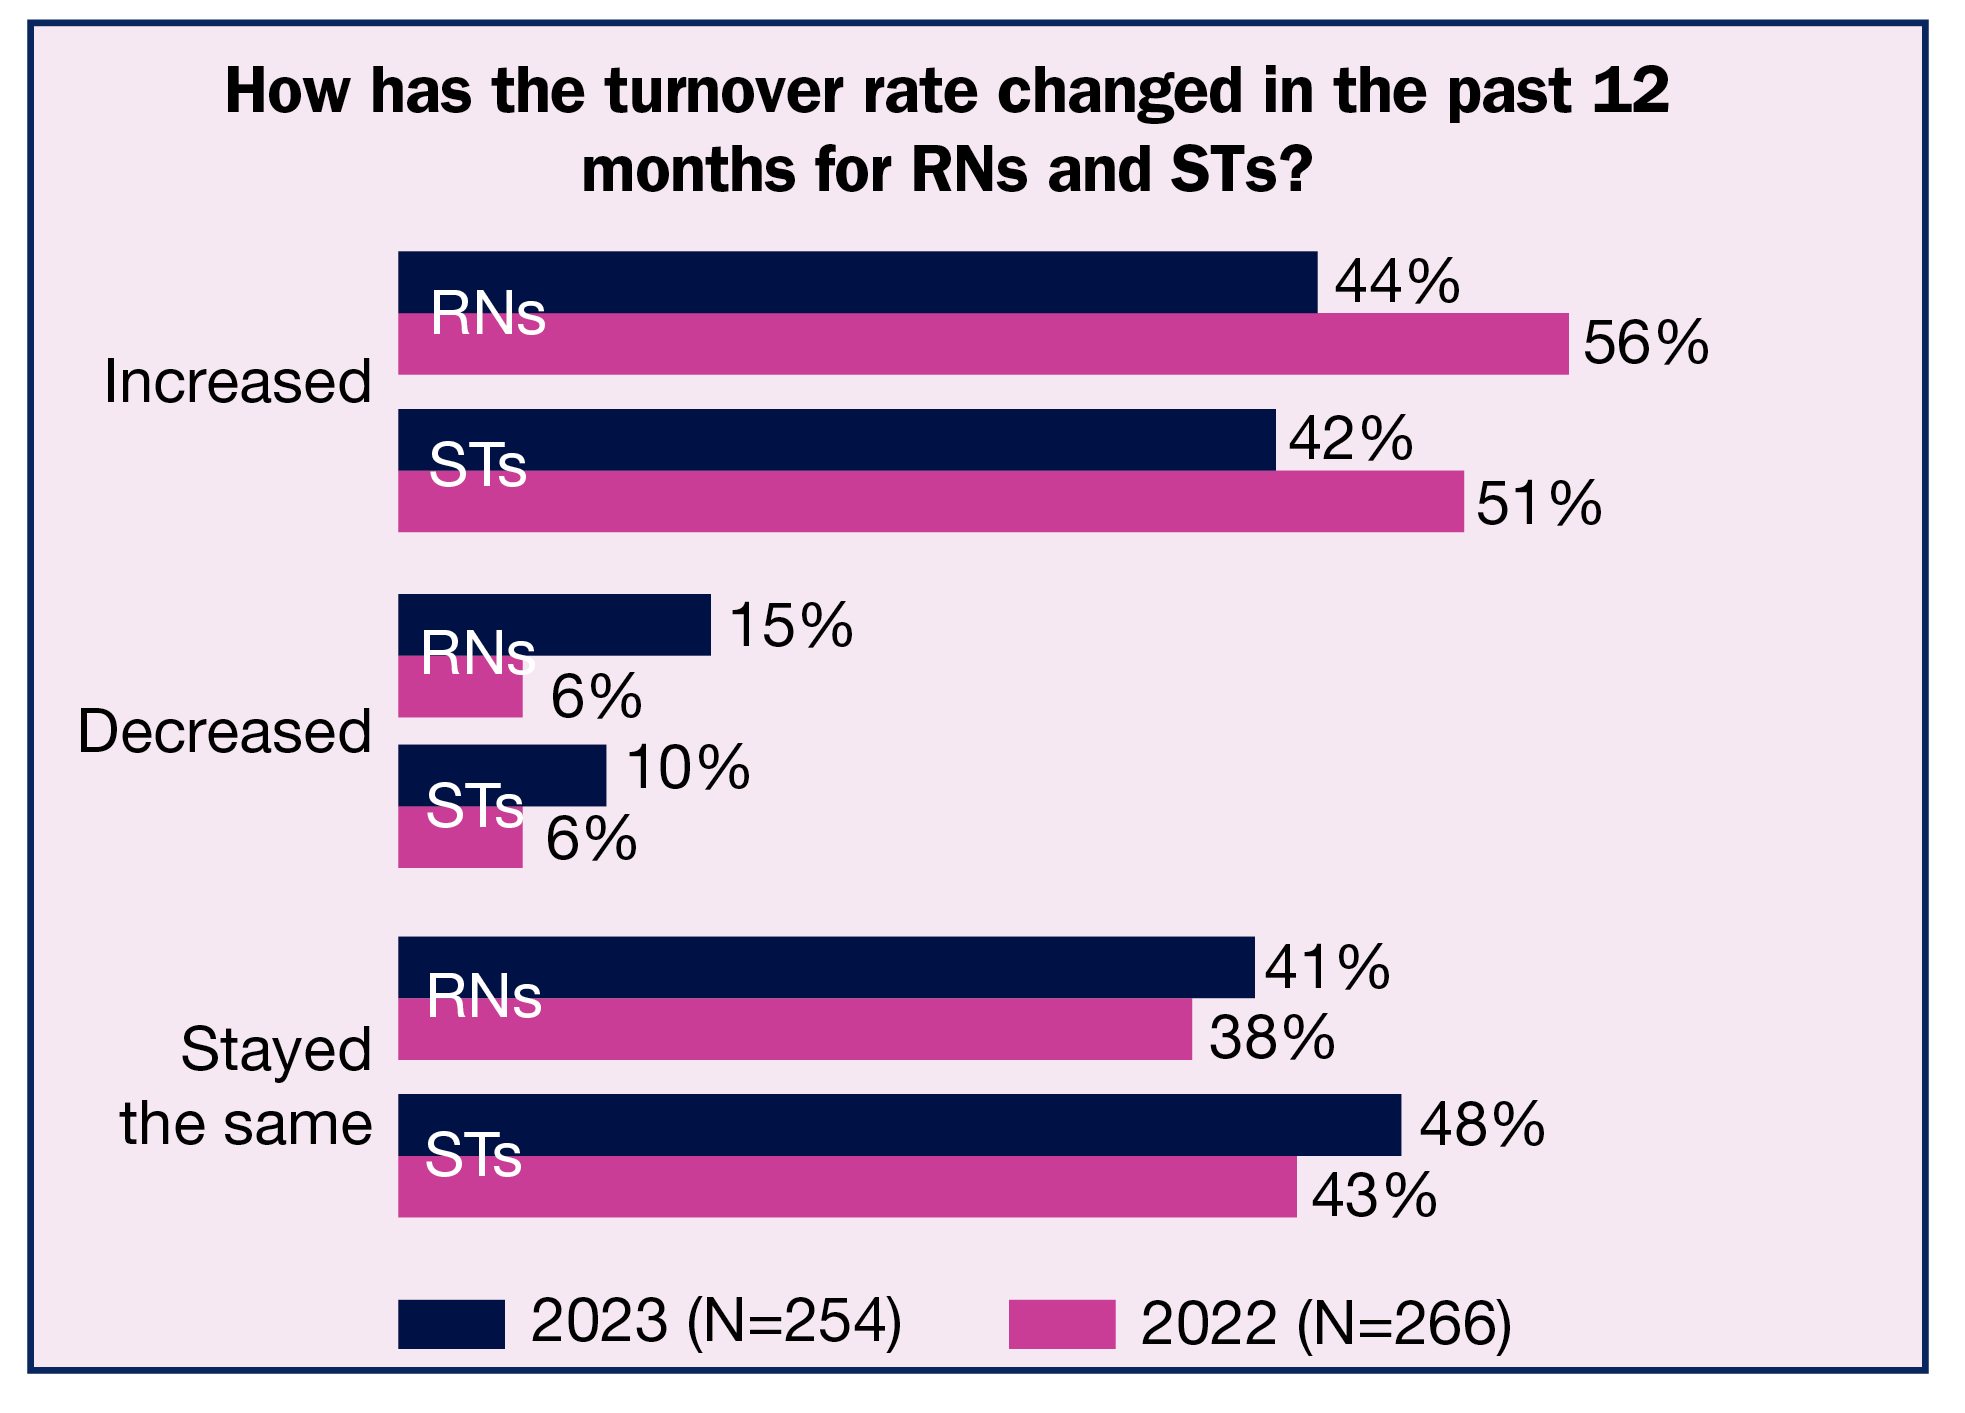
OR leaders typically welcome higher volume, but that welcome is now tempered by continued staffing woes. Although the percentages of those reporting the number of open full-time equivalent (FTE) positions for RNs and surgical technologists (STs) increased in the past 12 months has declined compared to last year, they remain high (45% and 48%, respectively). Similarly, reported percentages for increased turnover rates for RNs and STs were lower than last year, but are still concerning (44% and 42%, respectively).
Other key survey findings include:
- Recruiting challenges persist, with 70% of respondents reporting that it has been more difficult to recruit experienced OR RNs over the past year (vs 75% in 2022), and 65% have found recruiting STs to be more difficult (vs 67% in 2022).
- Surgical volume stayed the same for 26% of respondents, down from 36% in 2022. Only 7% reported decreased volume.
- Use of agency and travel staff continues, although the percentage of those who reduced their use in the past year increased from 14% in 2022 to 22% in 2023.
- The need to redeploy staff temporarily to another unit is trending downward, likely because the acute phase of the pandemic has receded. Only 13% reported taking this step in the past year, compared to 38% in 2022 and 66% in 2021.
This article focuses on findings related to hospital staffing. (Percentages may not add up to 100% due to rounding.)
Staffing woes
Many survey results reflect the seriousness of the staffing crunch for OR leaders.
Turnover. The average turnover rate in the past year was 16% for RNs and 15% for STs (compared to 18% for both groups in 2022), but the reported rates ranged from 0 to 100%. The percentage of respondents reporting an increased turnover rate declined from 56% in 2022 and 50% in 2021 to 44%. Similarly, 42% reported the turnover rate for STs had increased, down from 51% in 2022 and 48% in 2021. Although the declines are encouraging, turnover rates of more than 40% are problematic.
Open positions. As noted earlier, most respondents reported an increase in the number of open positions for RNs and STs, consistent with past surveys. For RNs, the percentage was 45%, down from 58% last year and comparable to 49% in 2021. This year, more respondents reported that the percentage had stayed the same (40%), up from 33% in 2022 and similar to 37% in 2021.
For STs, the percentage of respondents who reported an increase in open positions was 48%, down from 56% last year and the same as in 2021. In all, 42% said the percentage had stayed the same, up from 35% last year and comparable to 37% in 2021.
The numbers of open positions trended slightly downward compared to last year. For RNs, 19% of respondents report five to nine current open positions (down from 27% in 2022), 9% have 10 to 14 open positions (vs 12% in 2022), and 12% have 15 or more (vs 11% in 2022). Only 11% report no open positions, down from 9% in 2022.
The trend was more mixed for STs, with 19% reporting five to nine current open positions compared to 21% last year; 10% have 10 to 14 open positions (vs 12% in 2022), and 10% have 15 or more open positions (vs 5% in 2022). This year, 17% of respondents reported no open ST positions, down slightly from last year’s 19%.
Staffing changes. OR leaders reported several staffing changes over the past 12 months. One of the most common was losing staff who left the organization because of the pandemic (41% vs 51% in 2022). Another 31% lost staff who transferred to another unit.
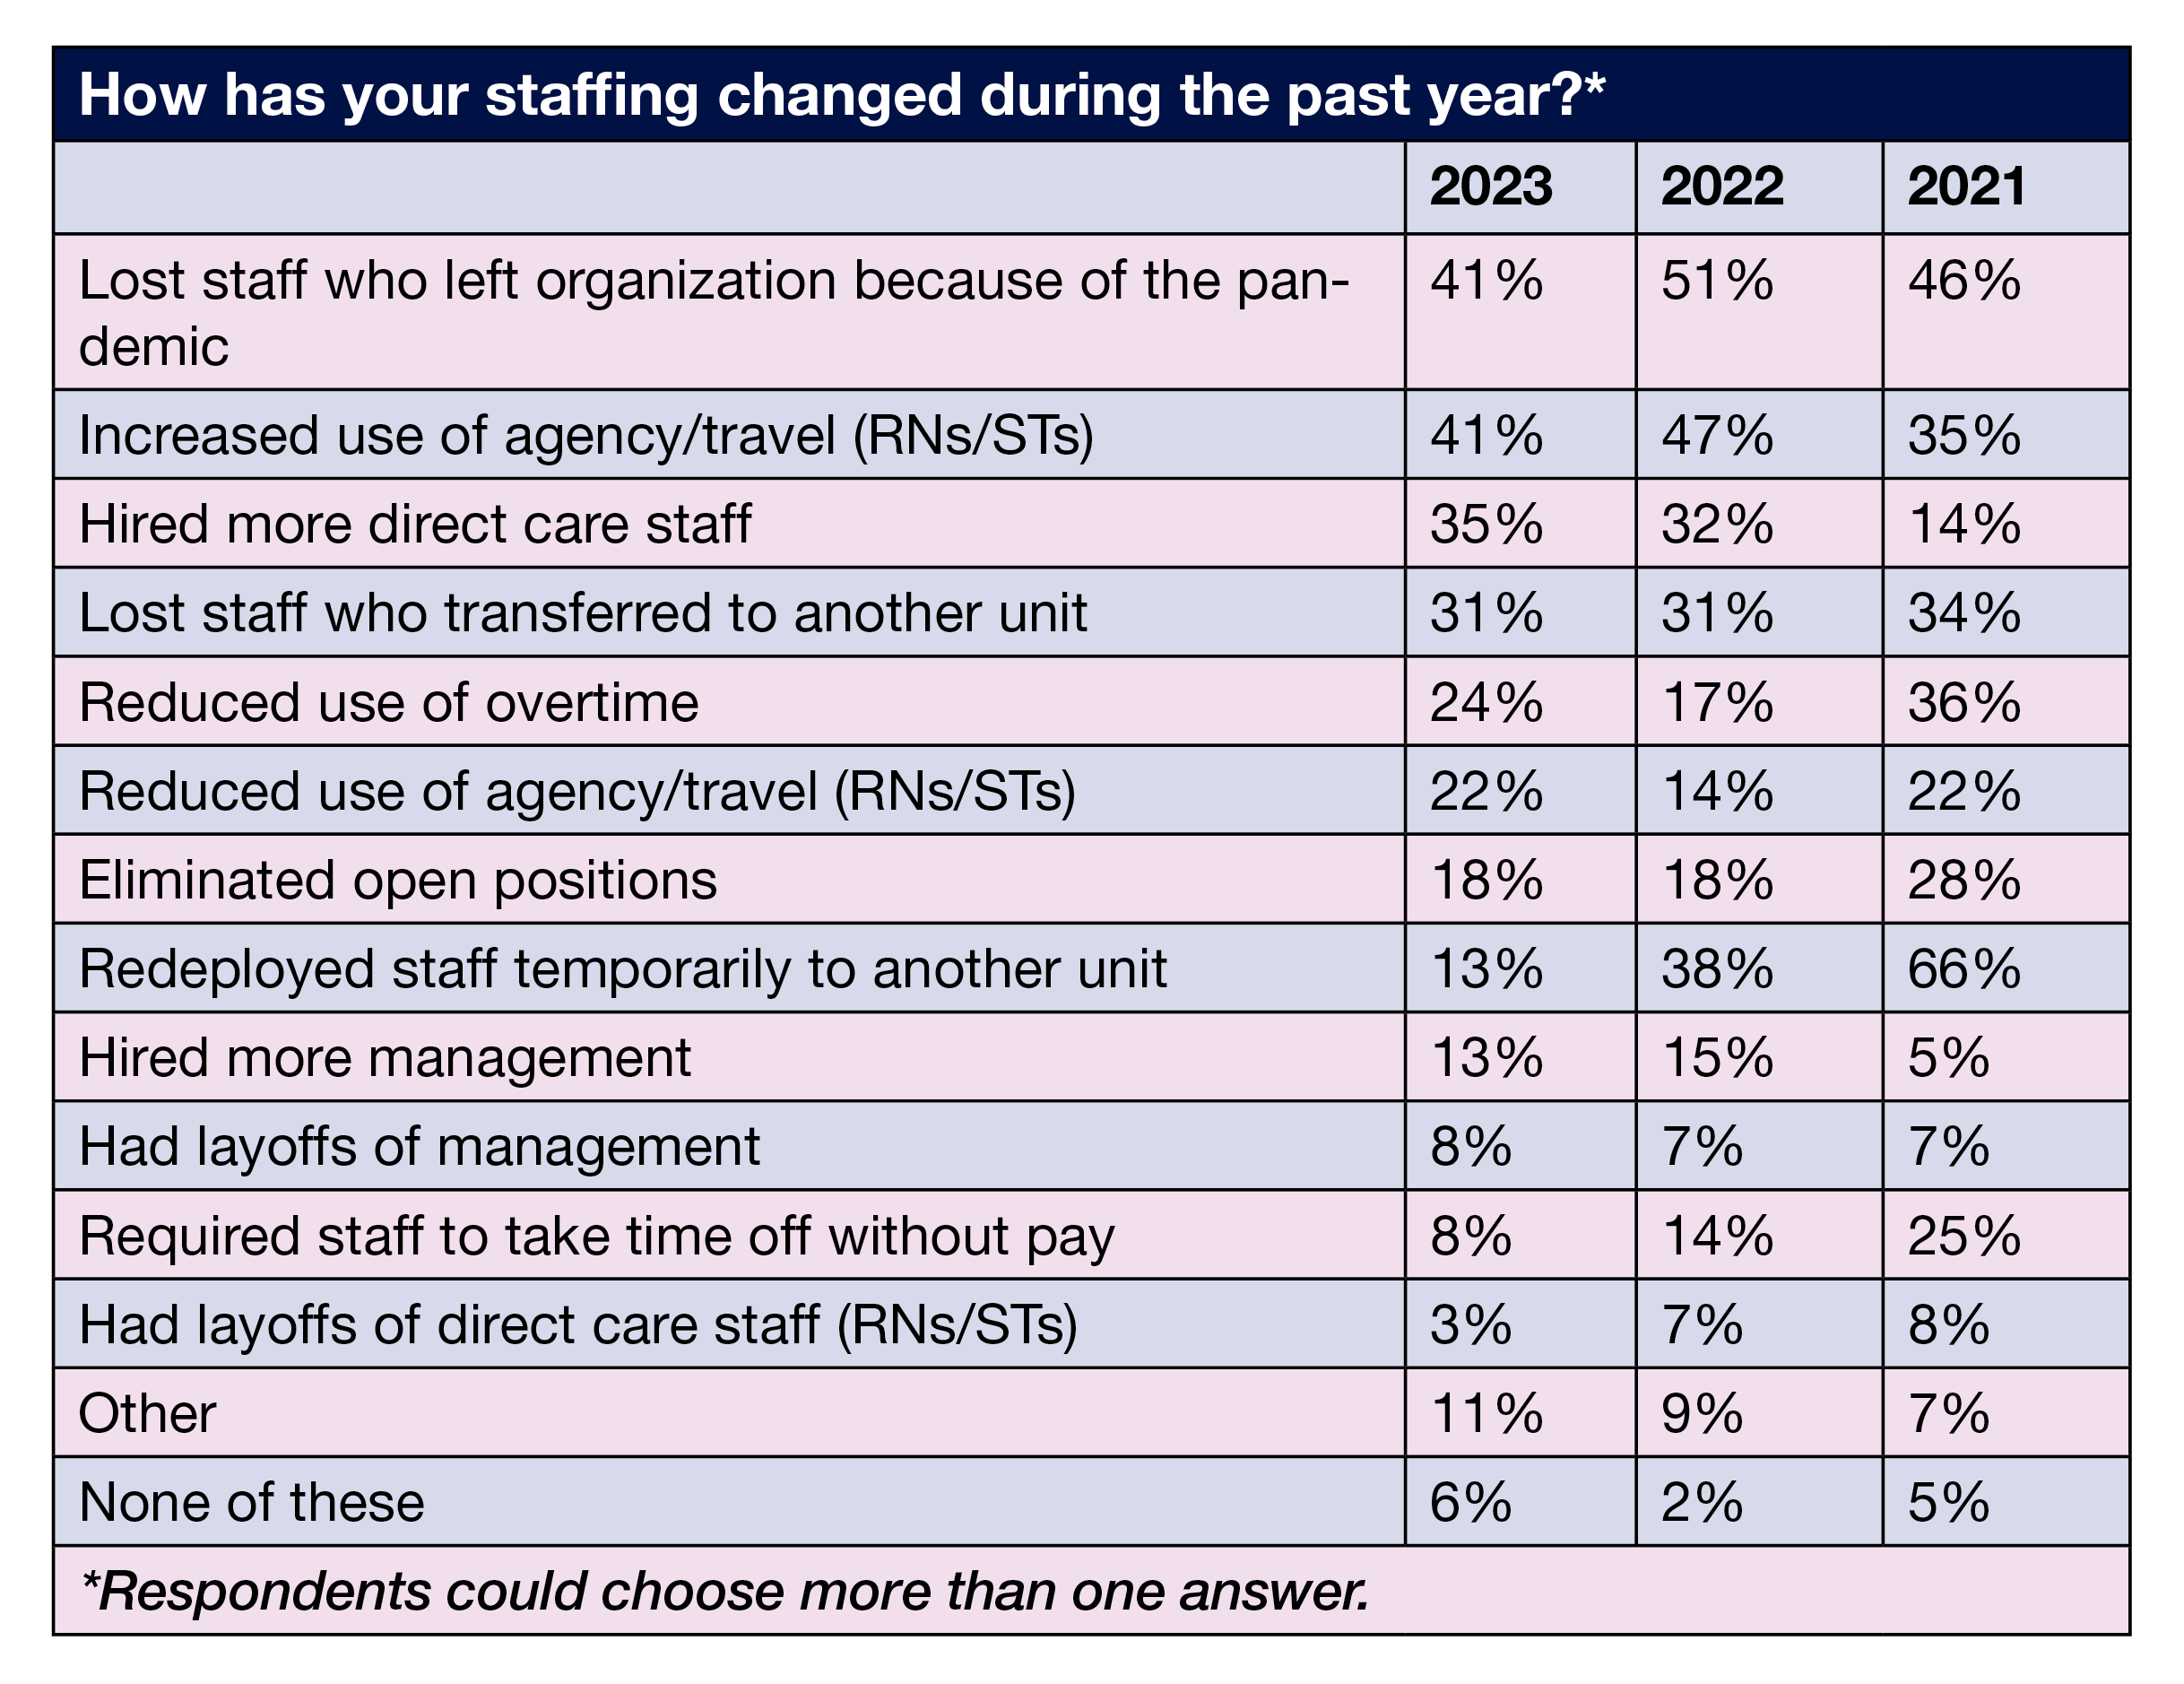
Although the percentage of OR leaders reporting more use of agency and travel RNs and STs declined from 47% in 2022 to 41% this year, it is more than double the 2019 prepandemic level of 20%. Other staffing strategies included hiring more direct care staff (35%), reducing use of overtime (24%) and eliminating open positions (18%).
Recruitment difficulties
According to a report from NSI Nursing Solutions, Inc., it takes an average of 98 days to fill an open OR nurse position. Respondents reported longer averages: 112 days for RNs (up from 94 days last year) and 130 days for STs (up from 112 days last year).
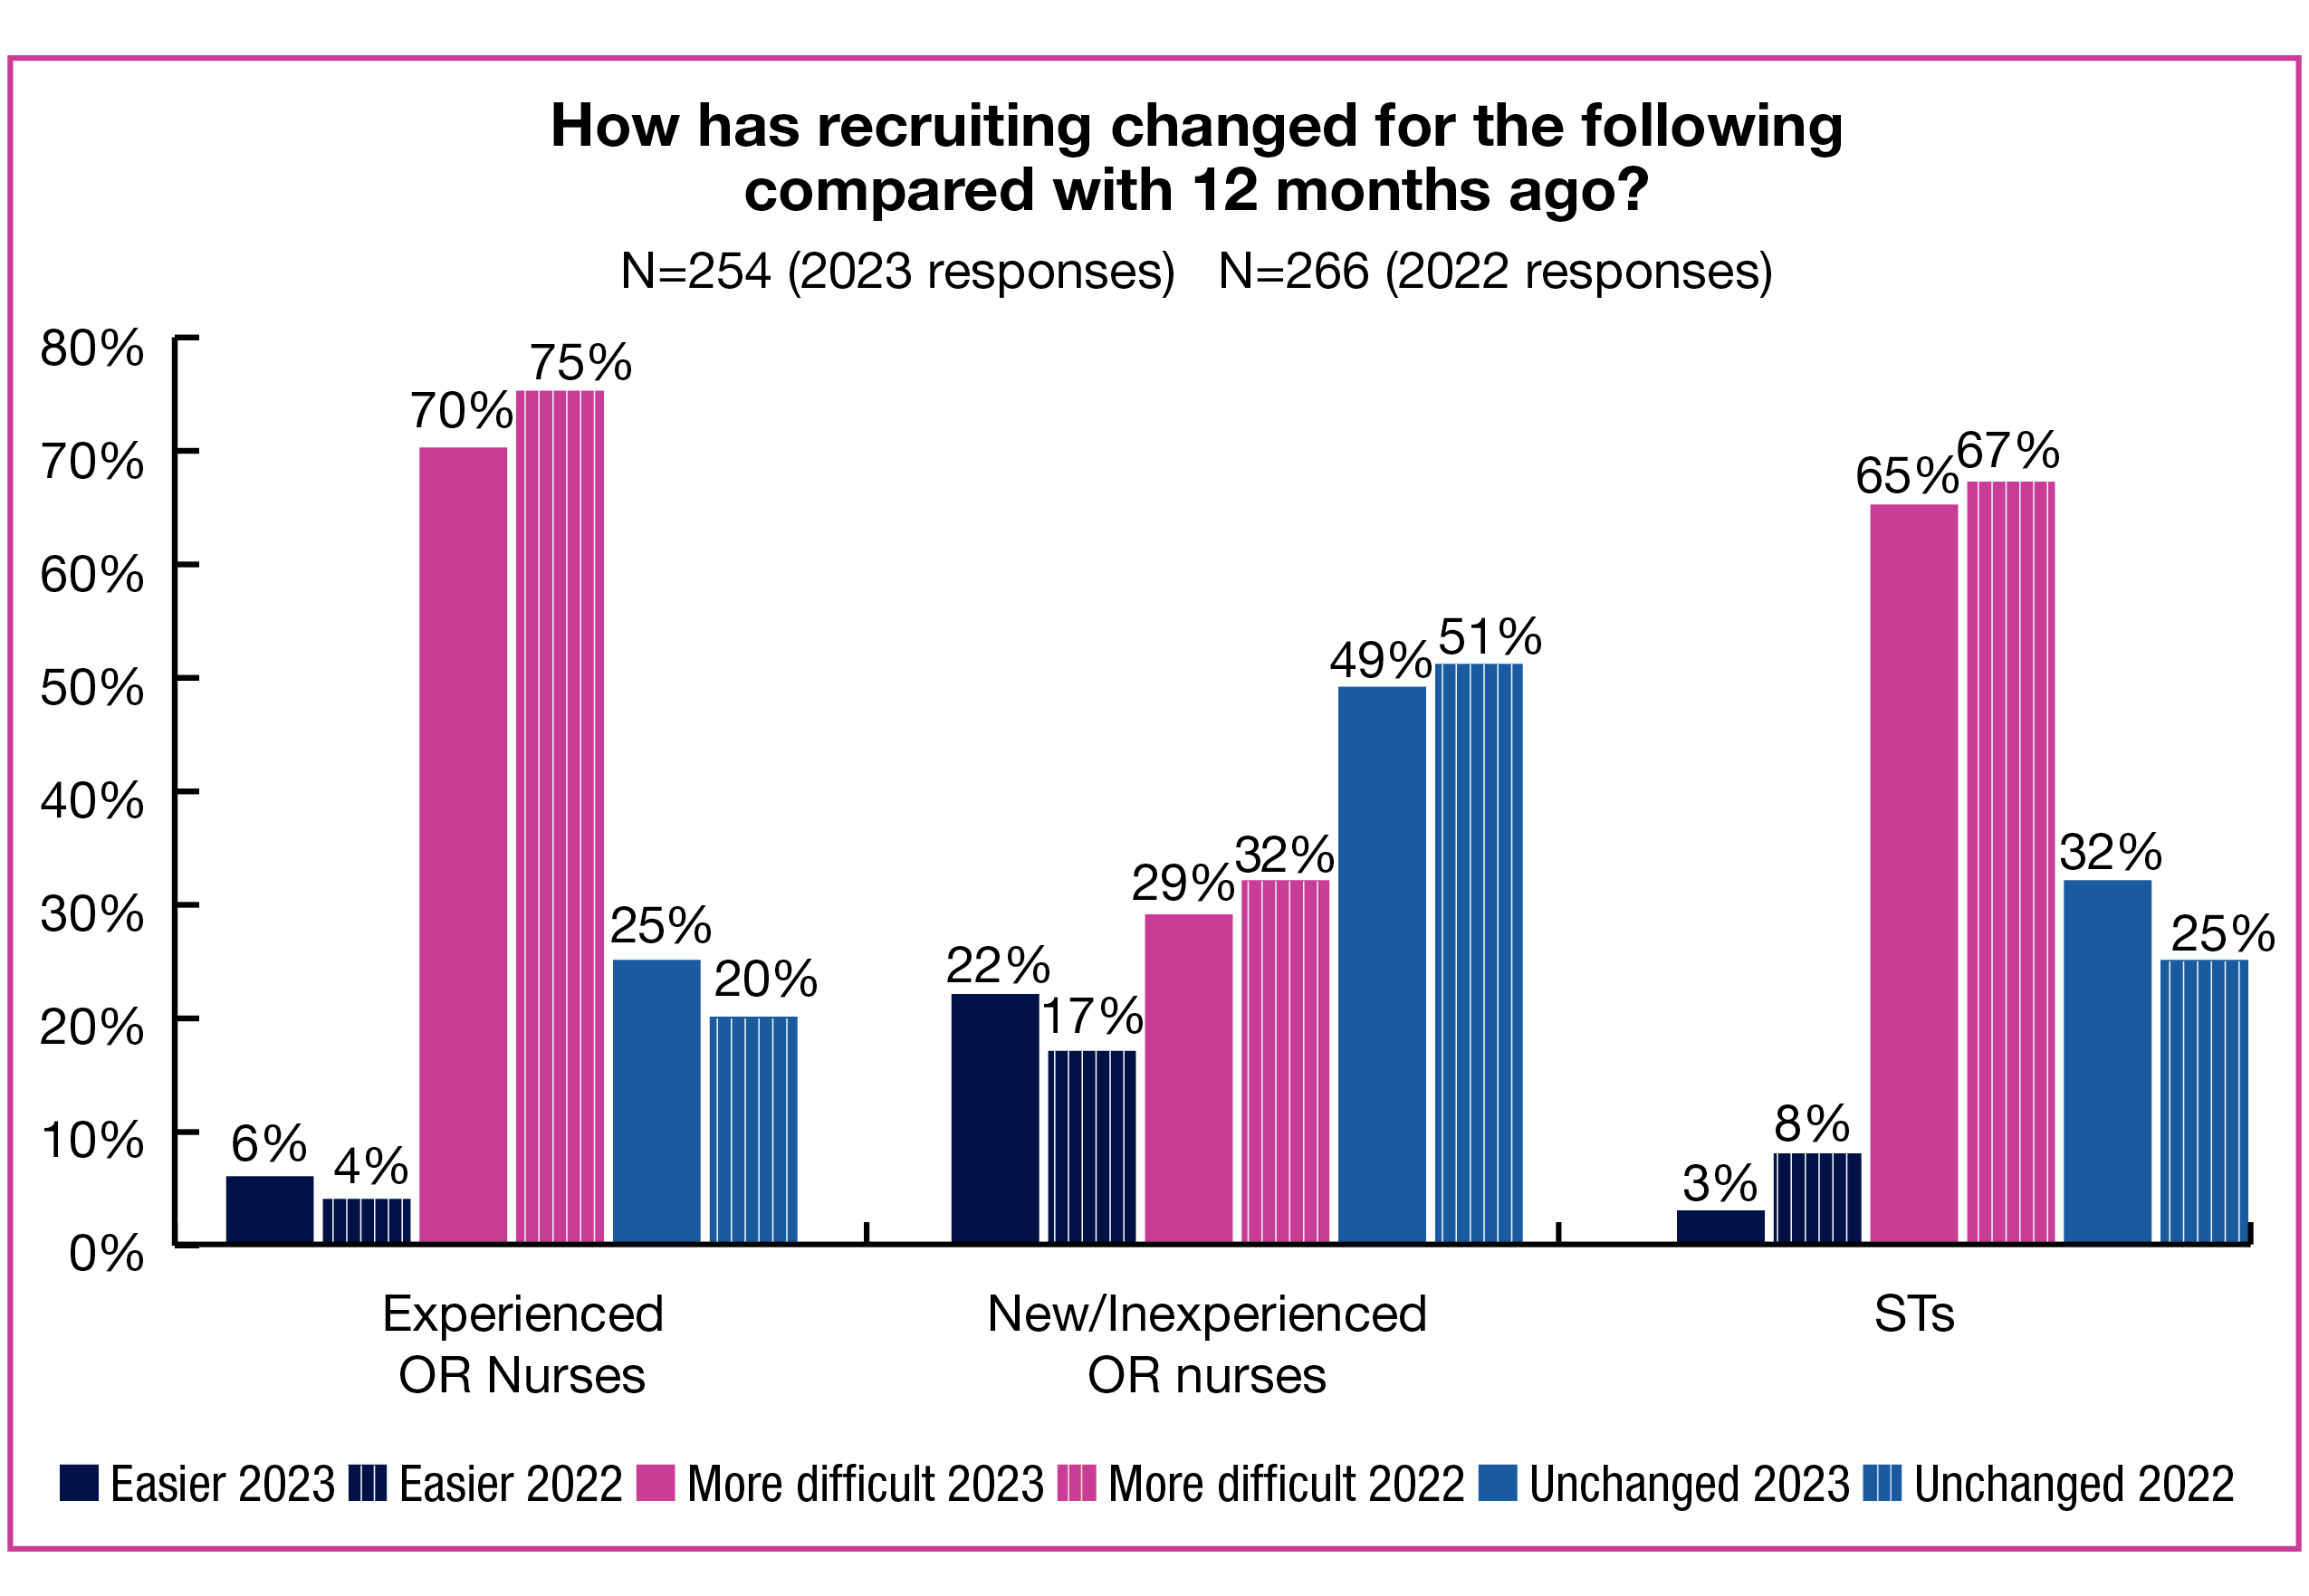
Given those numbers, it is not surprising that OR leaders face serious headwinds when it comes to recruiting. In addition to increased difficulty in recruiting experienced OR RNs (reported by 70% of OR leaders), 29% are finding it more difficult to recruit new and inexperienced OR nurses. The percentages reporting that recruitment was unchanged from last year were 25% for experienced OR nurses and 49% for new and inexperienced OR nurses.
OR leaders also are finding it hard to hire STs, with 65% of survey respondents reporting that recruitment had become more difficult (comparable to 2022’s 67%) and 32% reporting it was unchanged (vs 25% in 2022).
Recruitment requirements varied slightly from 2022, with 68% requiring an associate degree in nursing, up from 59%, and 37% requiring a baccalaureate degree in nursing, down from 44%. The percentage of respondents who require certification in perioperative nursing was 7%, the same as last year. Only 7% of OR leaders reported no degree or certification requirements, comparable to last year’s 6%.
Thoughts on productivity
Productivity has always been important in the perioperative setting, but increased volumes and limited staff has given it a new urgency both for OR leaders and those in the C-suite. We asked OR leaders to share challenges associated with measuring productivity.
A recurrent theme in the 224 responses was that the complexity of the perioperative setting makes measuring productivity difficult. Sample comments related to this theme included:
- “[It] doesn’t tell the whole picture.”
- “It does not capture all scenarios that we encounter daily, so it really does not give you an accurate view of your productivity.”
- “Targets not aligned with acuity, complexity of work.”
- “Accuracy of capturing minutes—particularly with boarding patients.”
- “Does not take into account turning over the room, case set up, and for SPD [sterile processing department] number of instruments for complex sets.”
- “No way to measure creating charts, preop phone calls, postop phone calls, etc.”
- “In SPD, they get no credit for cleaning all the equipment in the hospital, they only get credit for instrument trays.”
- “Benchmarks established in a different type of care environment.”
Another theme was the difficulty in obtaining accurate data, with many respondents having to rely on manual methods. Comments related to this issue included:
- “The information is not always accurate due to faulty reports.”
- “Too many sources of information.”
- “It is all hand extracted and calculated [because] commercial products are too expensive.”
- “Very limited informatics support so leadership and business manager have to design and develop their own tools.”
Finally, some took issue with the meaning of “productive,” with one respondent noting, “I have some non-clinical staff who are considered to be ‘unproductive,’ and this reflects poorly on my productivity, making it difficult to justify the need for nurses and scrub techs. However, these staff are my schedulers, sterile processing techs, and anesthesia techs who are necessary.”
OR Manager’s deep dive analysis on measuring productivity is also featured in this digital booklet.
Long-term challenges
The 2023 survey shows how persistent the staffing issue is for OR leaders. Many factors have led to the current crisis, with the COVID-19 pandemic topping a list that includes an aging workforce and a lack of nurses choosing the perioperative specialty. However, staffing was already difficult prepandemic; COVID-19 compounded those problems as nurses exited the specialty (or the profession entirely) and new nurses entered the workforce with less clinical experience as students. Unfortunately, these issues will likely continue for some time, posing a challenge for OR leaders committed to delivering safe care to patients.
Reference
NSI national healthcare retention & RN staffing report. NSI Nursing Solutions. 2023. https://www.nsinursingsolutions.com/Documents/Library/NSI_National_Health_Care_Retention_Report.pdf
Survey: ASC volumes continue to rise amid staffing challenges
By: Cynthia Saver

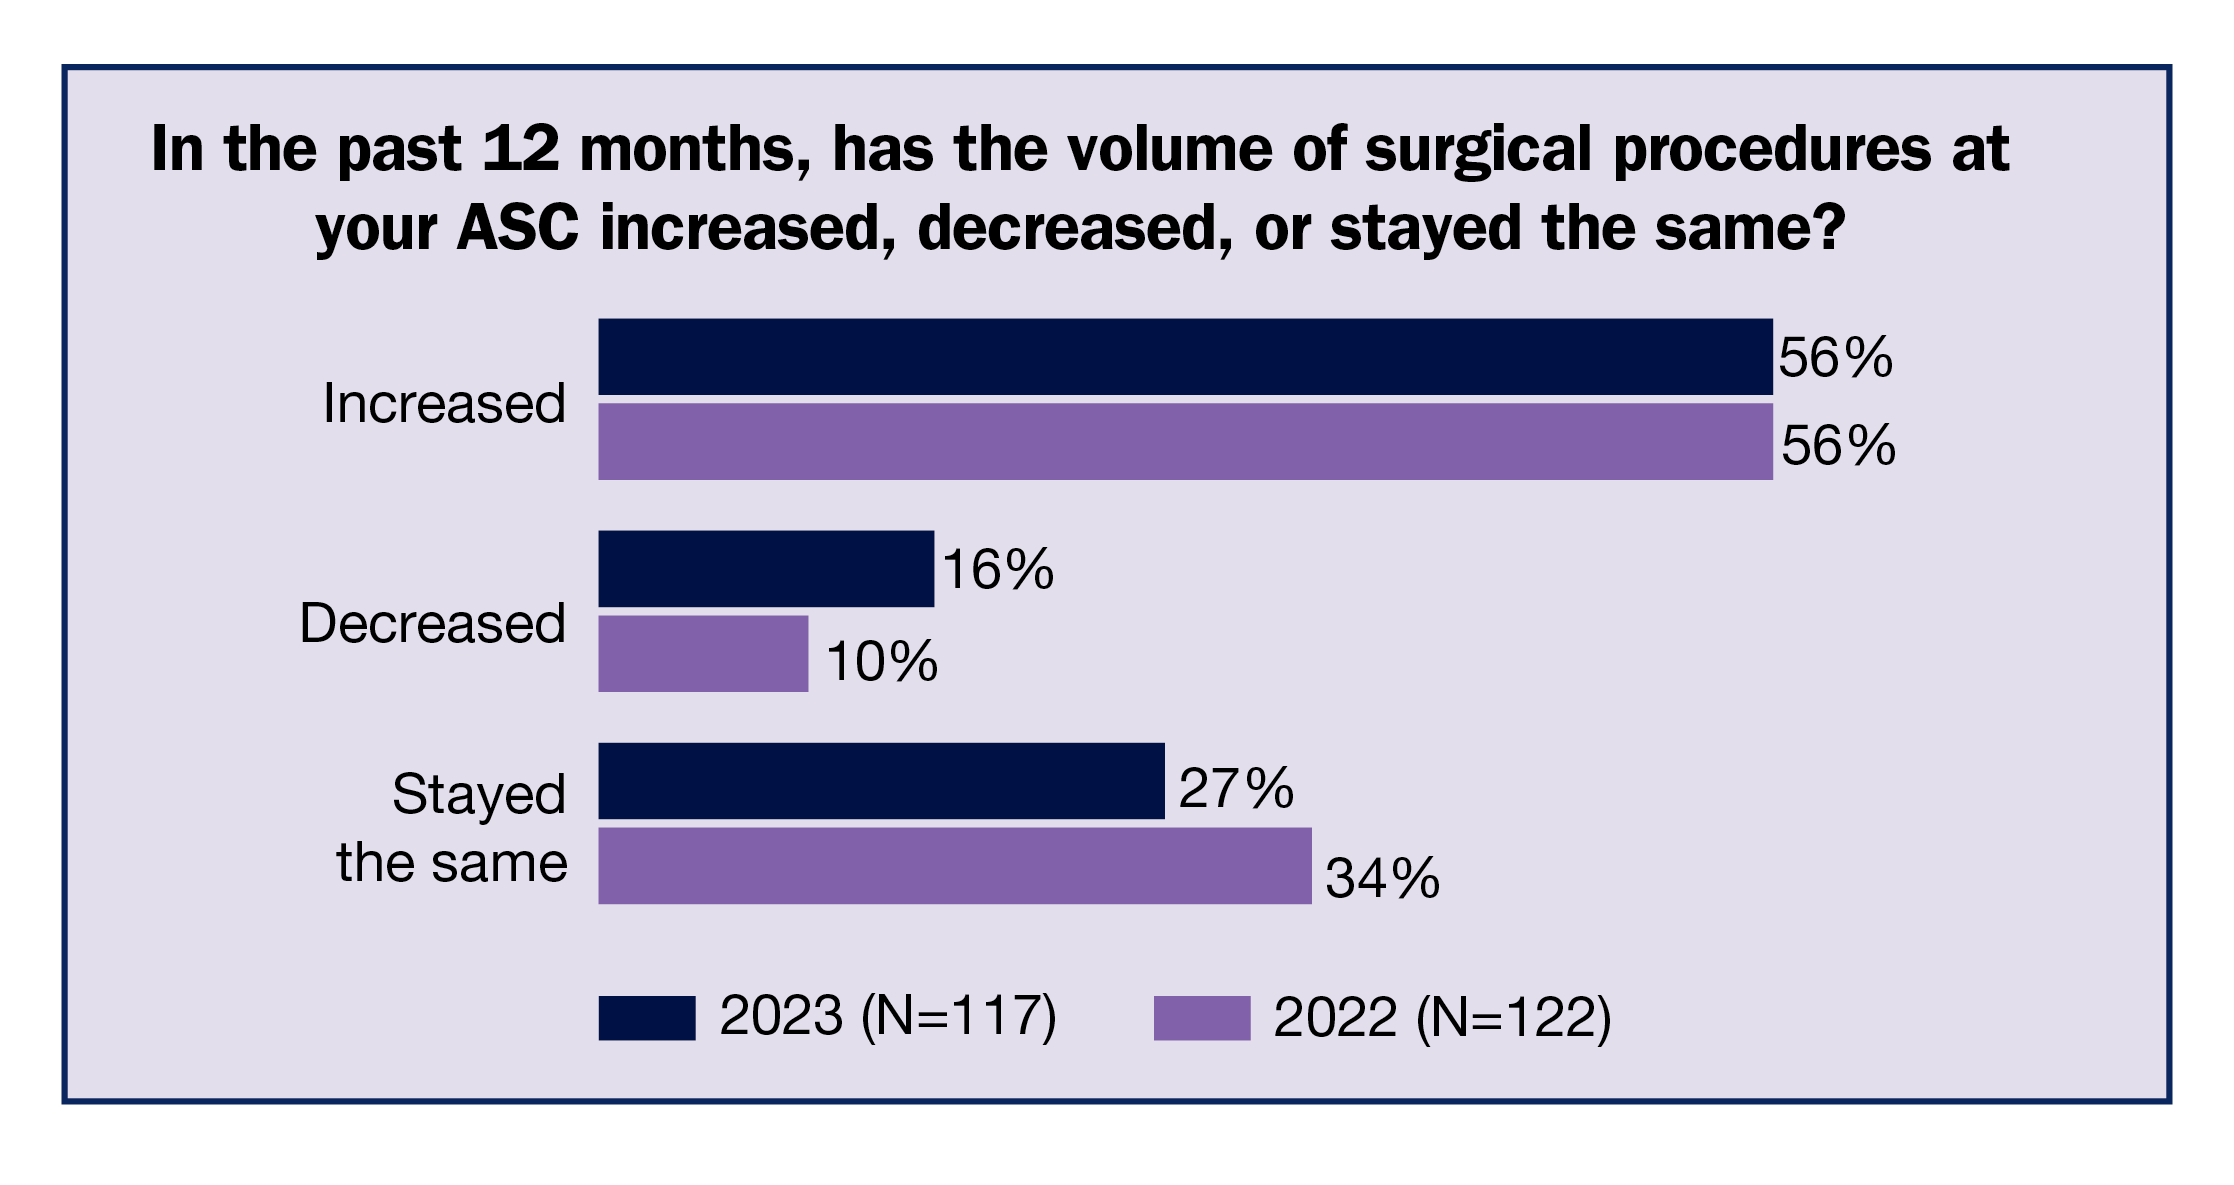
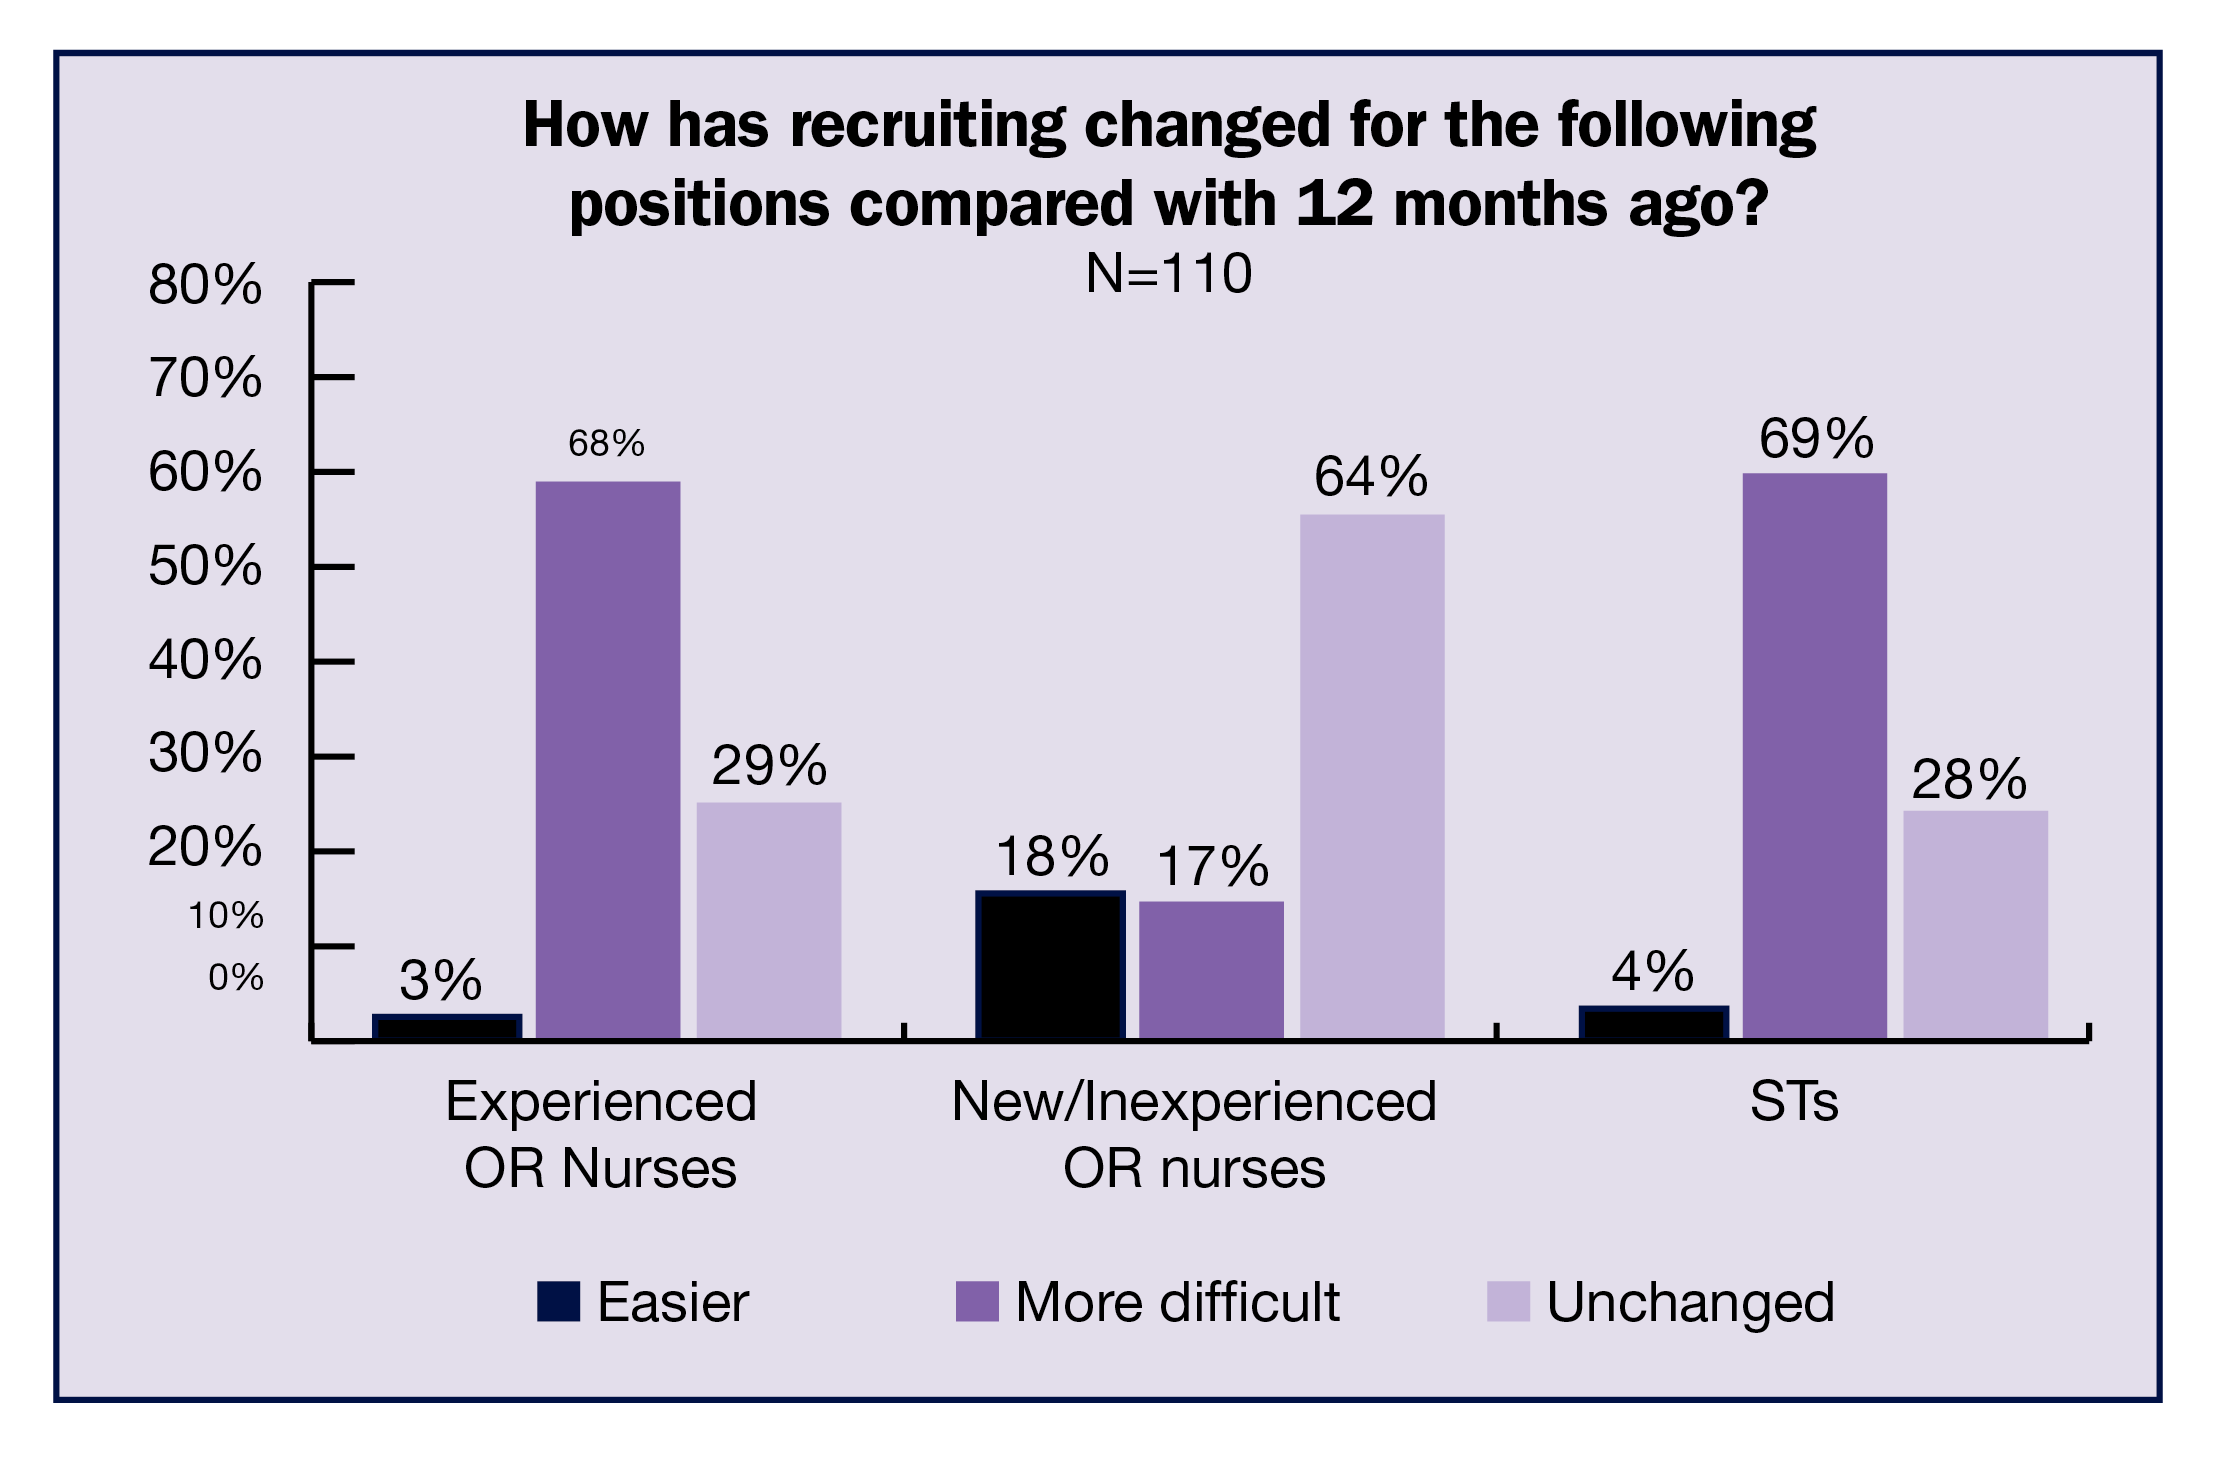
ASC leaders continue to see increased surgical volumes but are finding it difficult to staff their centers, according to the 2023 OR Manager Salary/Career Survey. More than half (56%) of respondents reported increased volume in the past 12 months, the same as last year. Yet the ability to recruit new staff remains a challenge, with more than two-thirds (68%) reporting that recruiting experienced OR nurses is more difficult than 12 months ago. Recruiting surgical technologists (STs) is also challenging, with 69% of respondents finding recruitment more difficult.
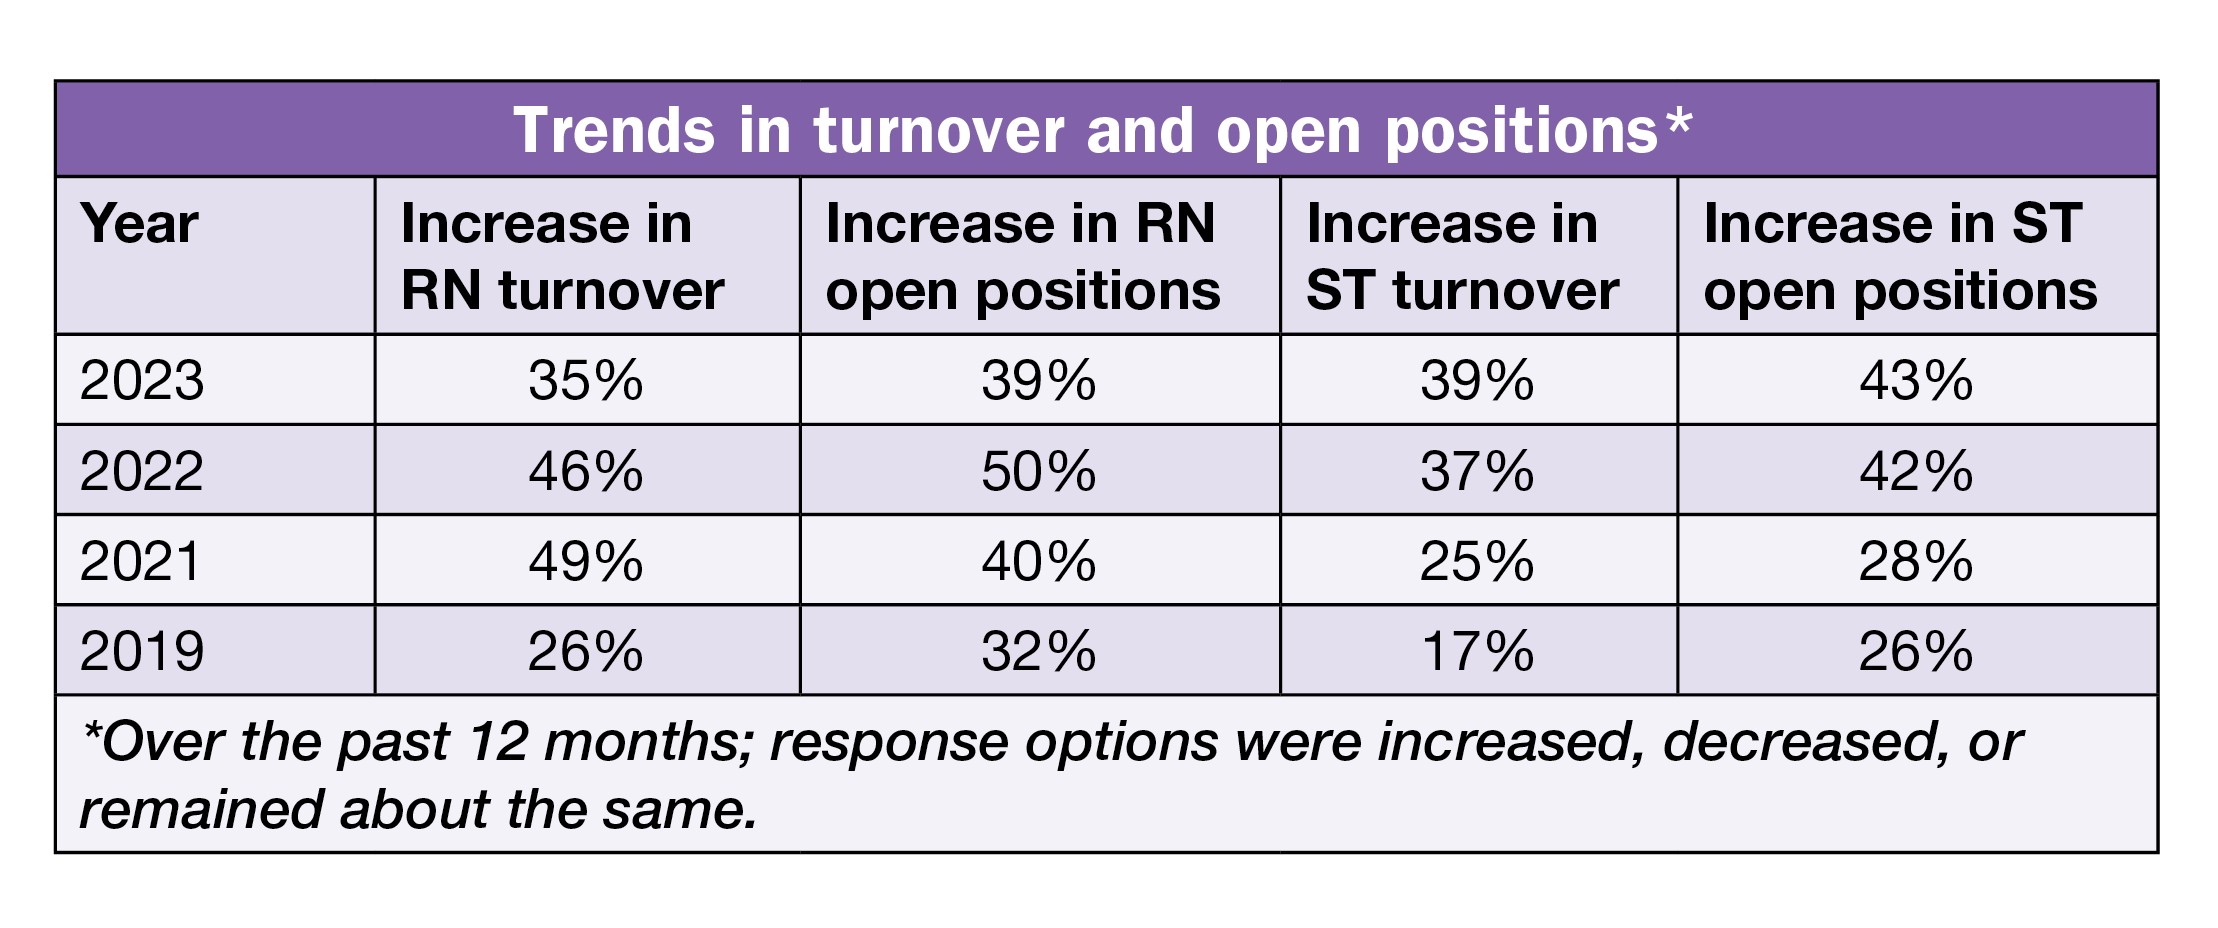
One small positive sign is that the percentage of ASC leaders reporting an increase in open RN positions declined from 50% in 2022 to 39% this year, and the percentage for increased RN turnover rate declined from 46% to 35%. However, the high percentages still indicate widespread difficulties.
Other survey highlights include:
- The percentage of respondents reporting an increase in open positions for STs was 43%, and 39% reported an increase in ST turnover rate. Both percentages are comparable to 2022 figures—42% and 37%, respectively.
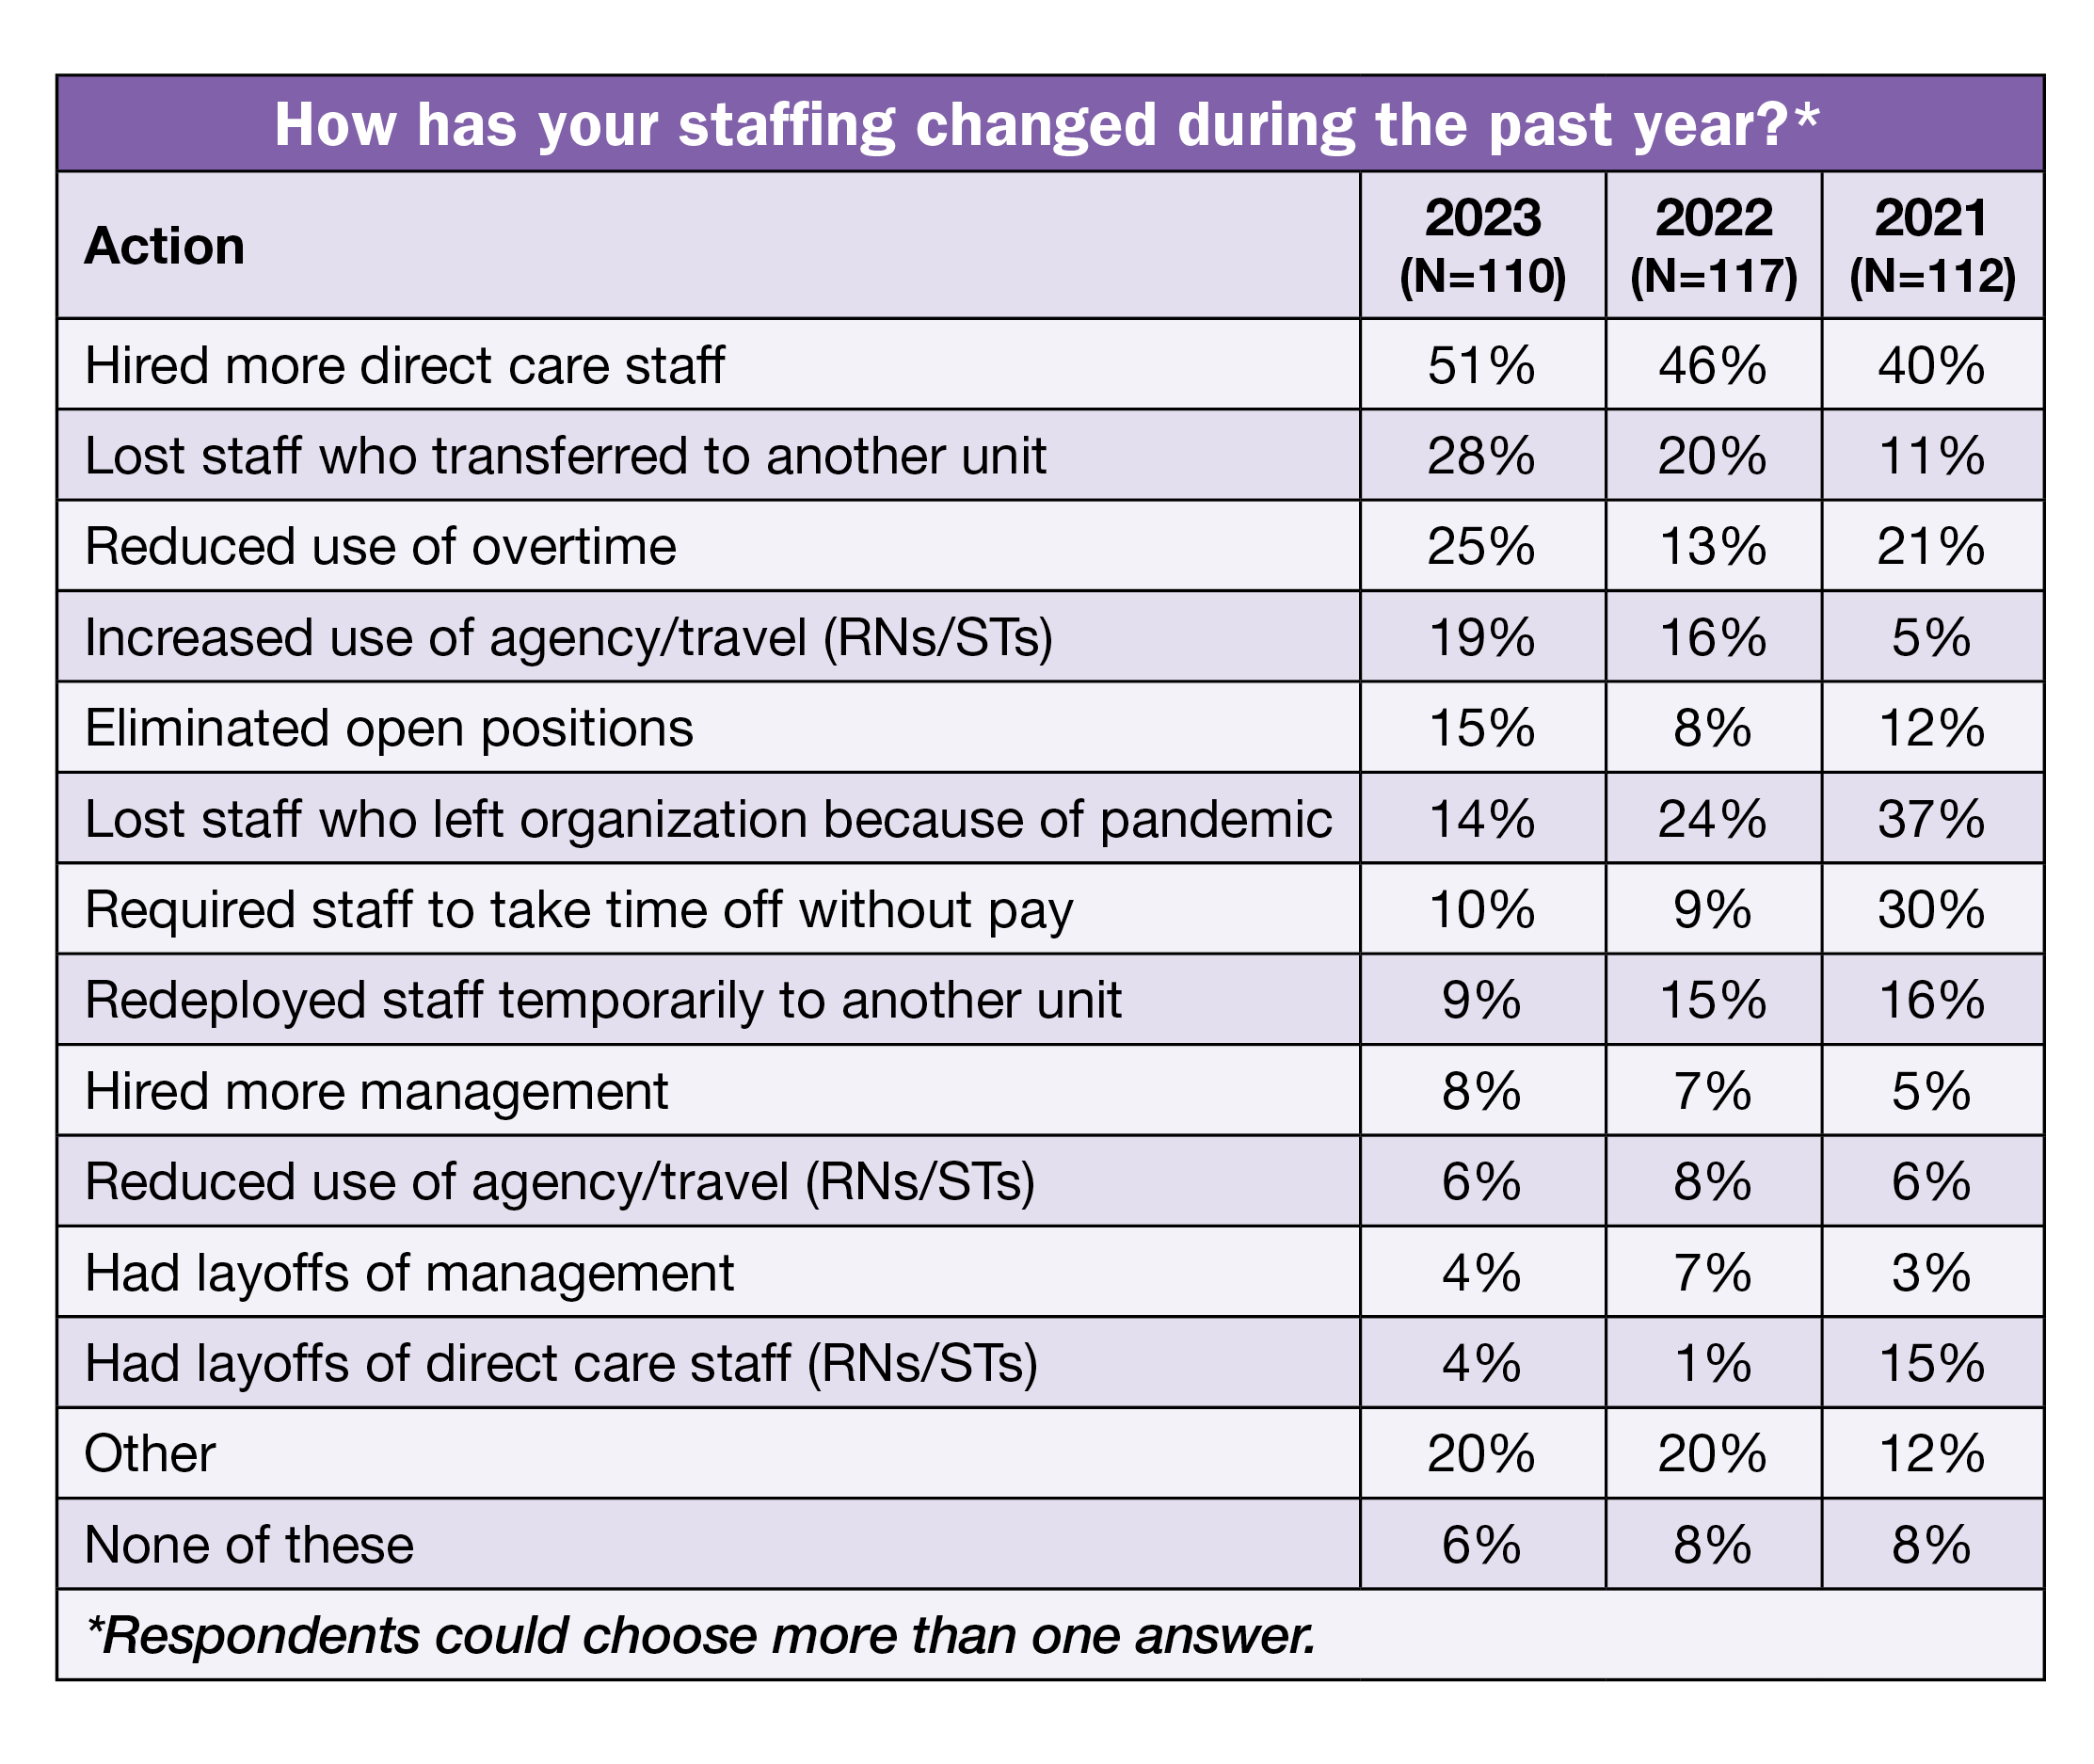
- Even though recruitment was difficult, more than half (51%) hired more direct care staff in the past year, compared to 46% last year.
- Loss of staff who left the ASC because the COVID-19 pandemic continued to trend downward (37% in 2021, 24% in 2022, and 14% in 2023).
- Many (19%) ASC leaders have increased their use of agency and travel staff in the past year.
This part focuses on findings related to ASC staffing. (Percentages may not add up to 100% due to rounding.)
Staffing trends
Survey results reflect a continued difficulty with staffing, particularly when compared to prepandemic levels.
Turnover. Although the percentage of respondents reporting that RN turnover rate had increased over the past year declined, the 35% figure is still much higher than the 26% from the prepandemic year of 2019. Only 9% reported a decrease, and the rate was unchanged for 55% of respondents. For STs, the 39% who reported increased turnover was far higher than the 17% seen in 2019, although comparable to 2022’s 37%. More than half (53%) said it had stayed the same, and only 8% reported a decrease.
Open positions. Similar to turnover, although the percentage of respondents reporting that the number of RN open positions that increased in the past year was lower than last year, the 39% is higher than the 2019 prepandemic level of 32%. Nearly half (48%) reported the rate was unchanged, and 13% reported a decrease. For STs, the 43% who experienced an increase is nearly double what it was in 2019 (26%). Almost half (49%) said the rate was unchanged, and 8% reported a decrease.
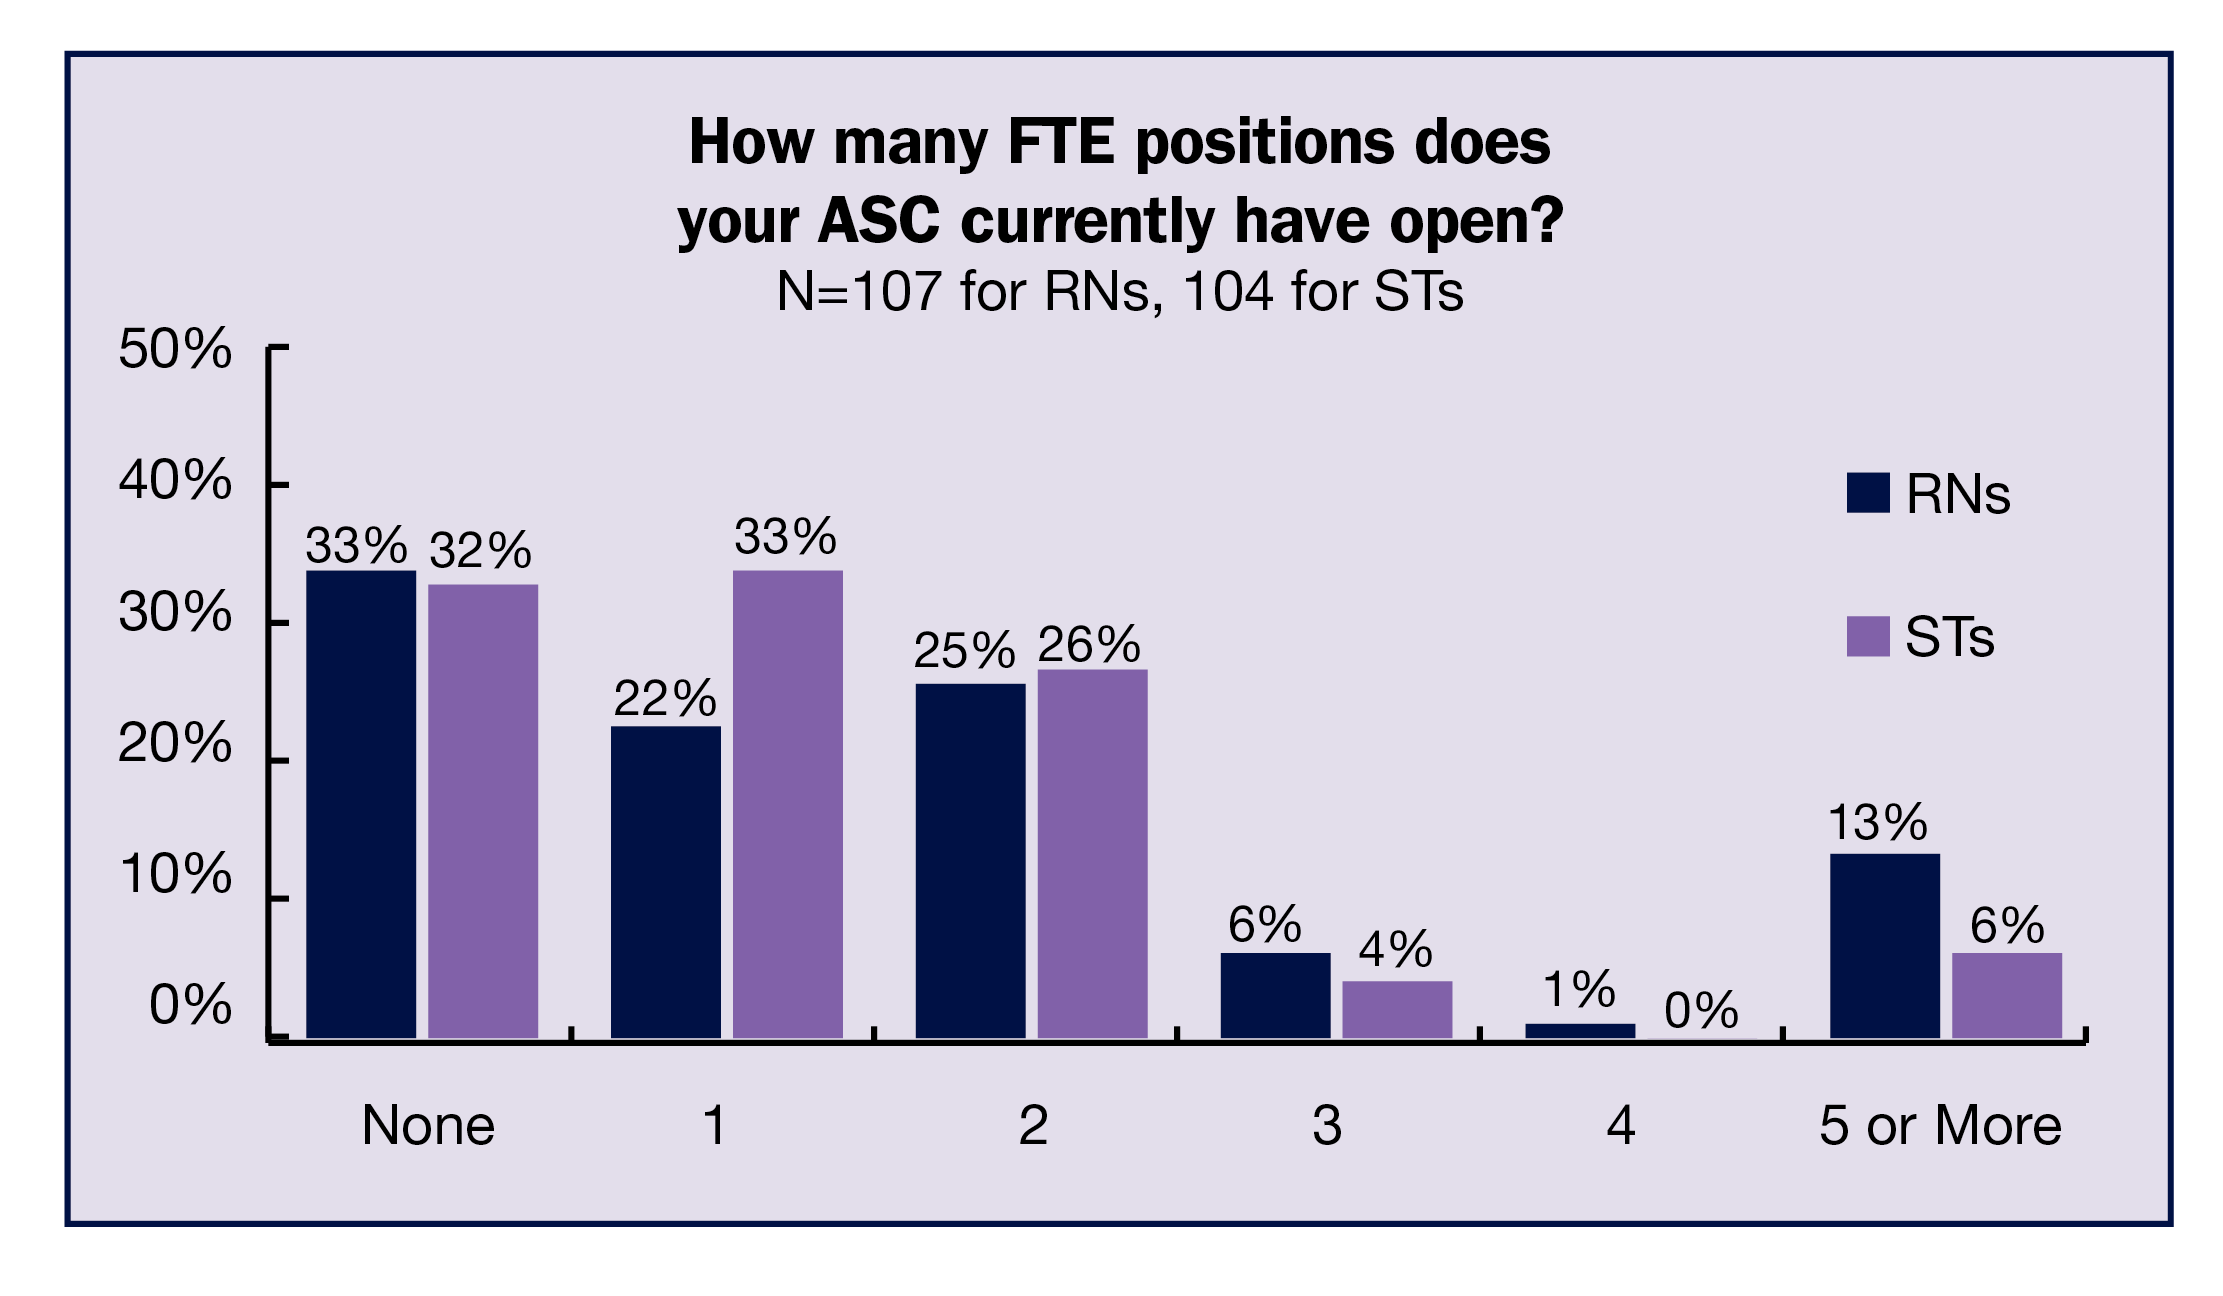
A third of respondents reported having no current open full-time equivalency (FTE) RN positions (comparable to 32% in 2022); 67% had at least one open position, comparable to 2022’s 68%, but much higher than 2019’s 56%. The breakdown for 2023 was: 23% for one open position, 25% for two, 6% for three, 1% for four, and 13% for five or more open positions.
For STs, 32% of respondents had no current open FTE positions; 68% had at least one, up slightly from 63% in 2022, but higher than 45% in 2019. The breakdown for 2023 was: 33% for one open position, 26% for two, 4% for three, zero for 4, and 6% for five or more open positions.
Recruitment. Recruiting for open positions remains problematic for most respondents, with 68% reporting it was more difficult to recruit experienced OR nurses, up from 63% in 2022; in 2019, the percentage was 58%. Interestingly, only 17% reported increased difficulty with recruiting new or inexperienced OR nurses, down from 34% in 2022, but only slightly higher than the 13% reported in 2019.
ST recruitment is not any easier. More than two-thirds (69%) reported that recruitment is more difficult, up from 58% last year and 55% in 2021. The 2019 prepandemic percentage was 49%.
Recruitment difficulty is reflected in the time it takes to fill positions. The average time was 82 days for RNs (down significantly from 115 days in 2022) and 98 days for STs (down from 109 days in 2022). According to a report from NSI Nursing Solutions, Inc, it takes an average of 98 days to fill an open OR nurse position in the hospital.
Staffing changes. The most common staffing change during the past year was hiring more direct care staff, reported by more than half (51%) of respondents, up from 46% in 2022 and 40% in 2021, although in 2019, 46% reported this change. The next most common changes were losing staff who transferred to another unit (28%) and reduced use of overtime (25%, up from 13% last year). Only 14% lost staff who left the organization because of the pandemic, down from 24% last year, and only 9% had to redeploy staff temporarily to another unit (down from 15%).
The 22 “other” comments related to staffing changes included loss of staff due to retirement, higher paying jobs, or travel positions.
Work characteristics
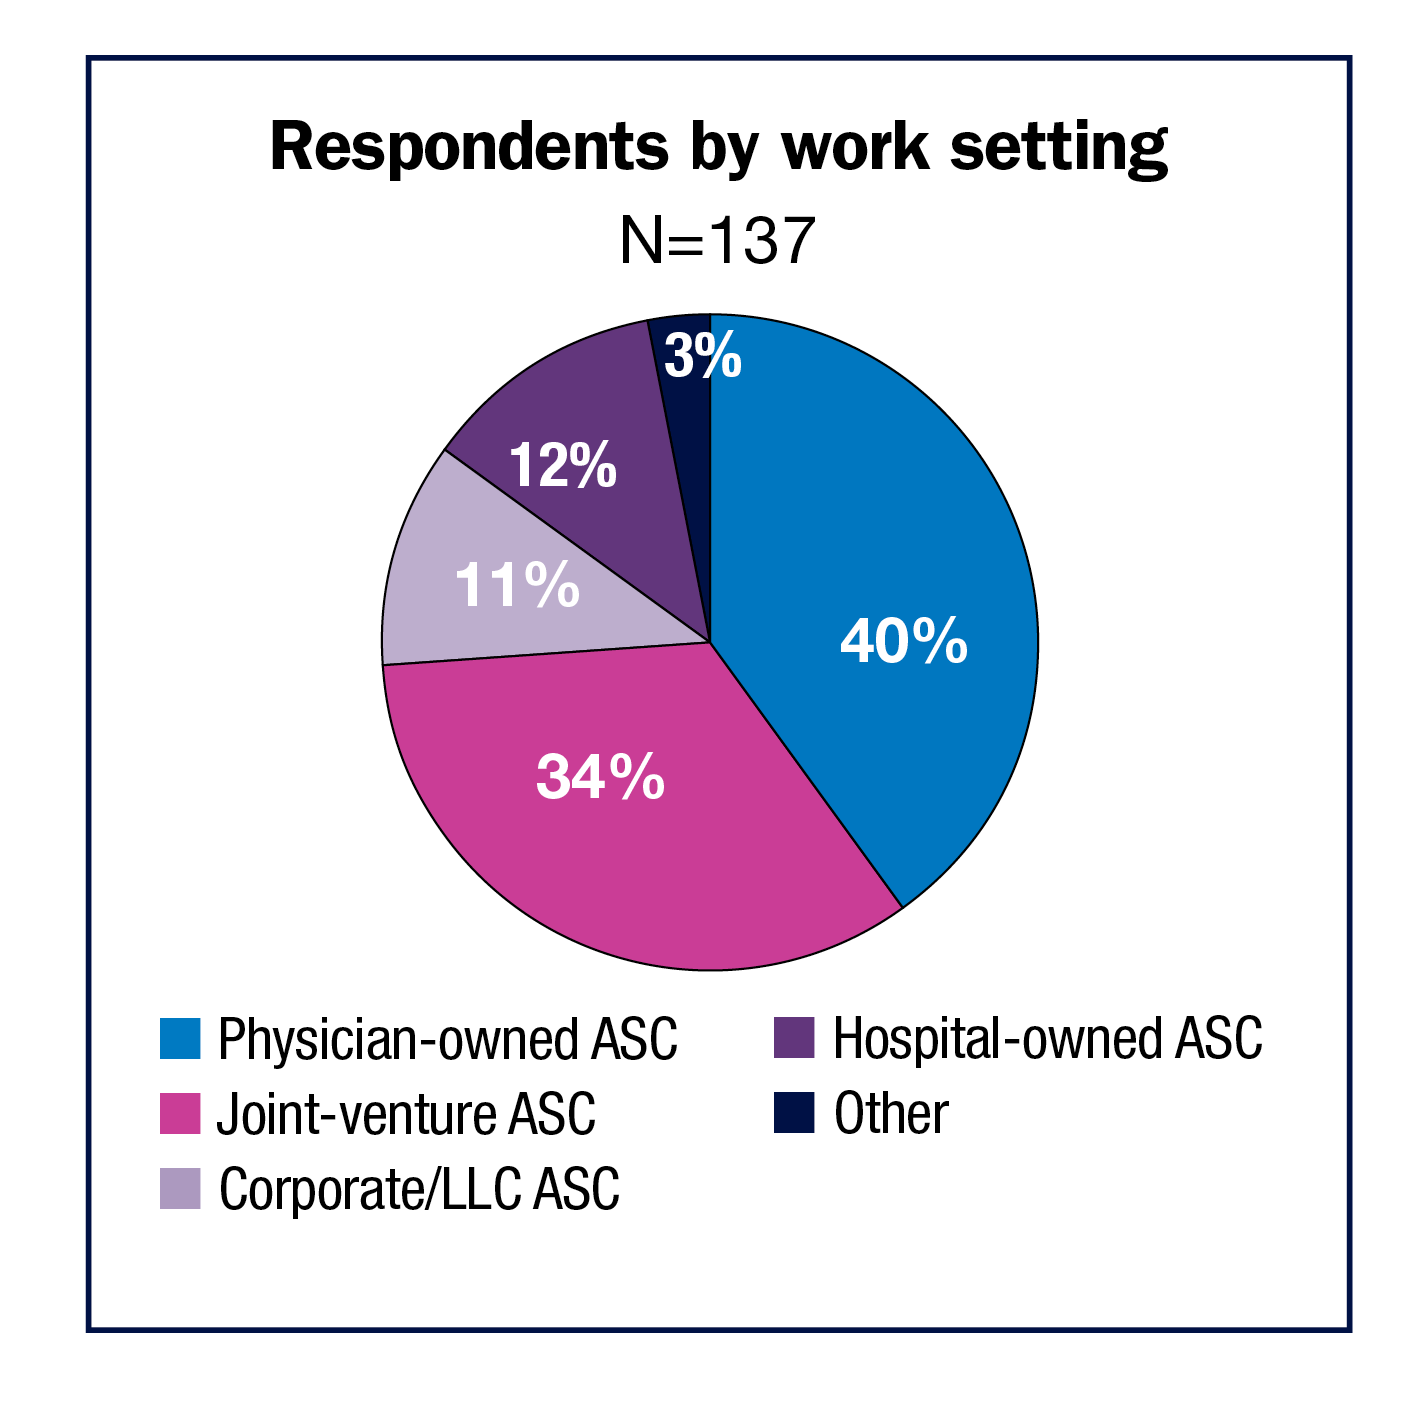
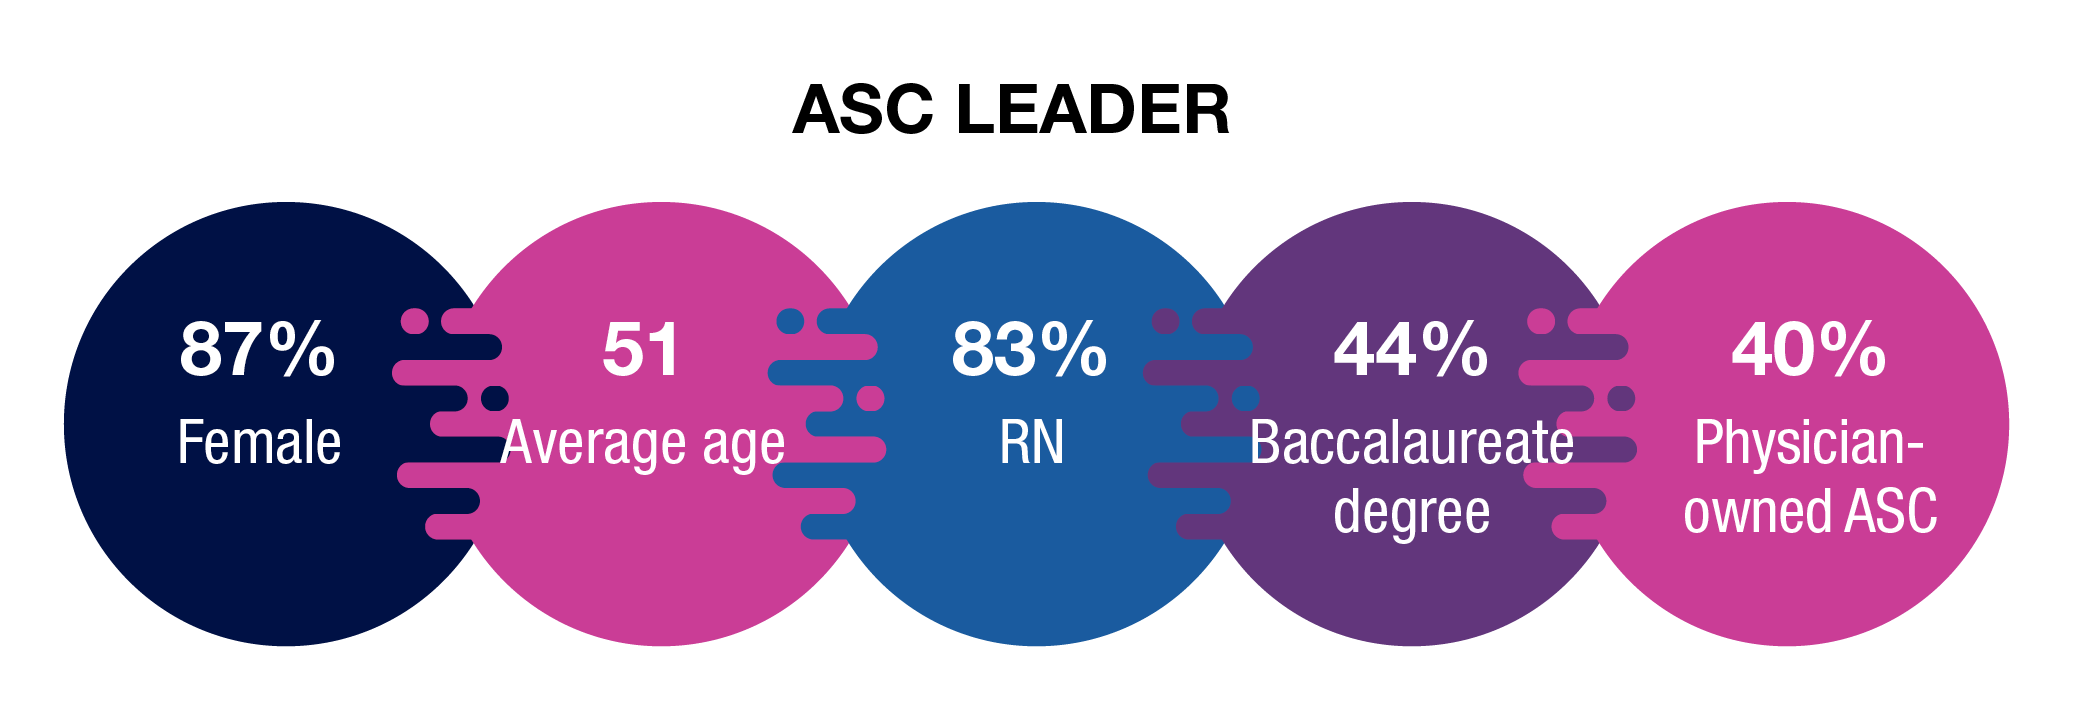
Most (40%) respondents work in a physician-owned ASC, with another third in a joint-venture ASC. The remaining start their day in a hospital-owned (12%) or corporate or LLC ASC (11%). Respondents were more likely to work in a multispecialty ASC than a single specialty one (60% vs 40%).
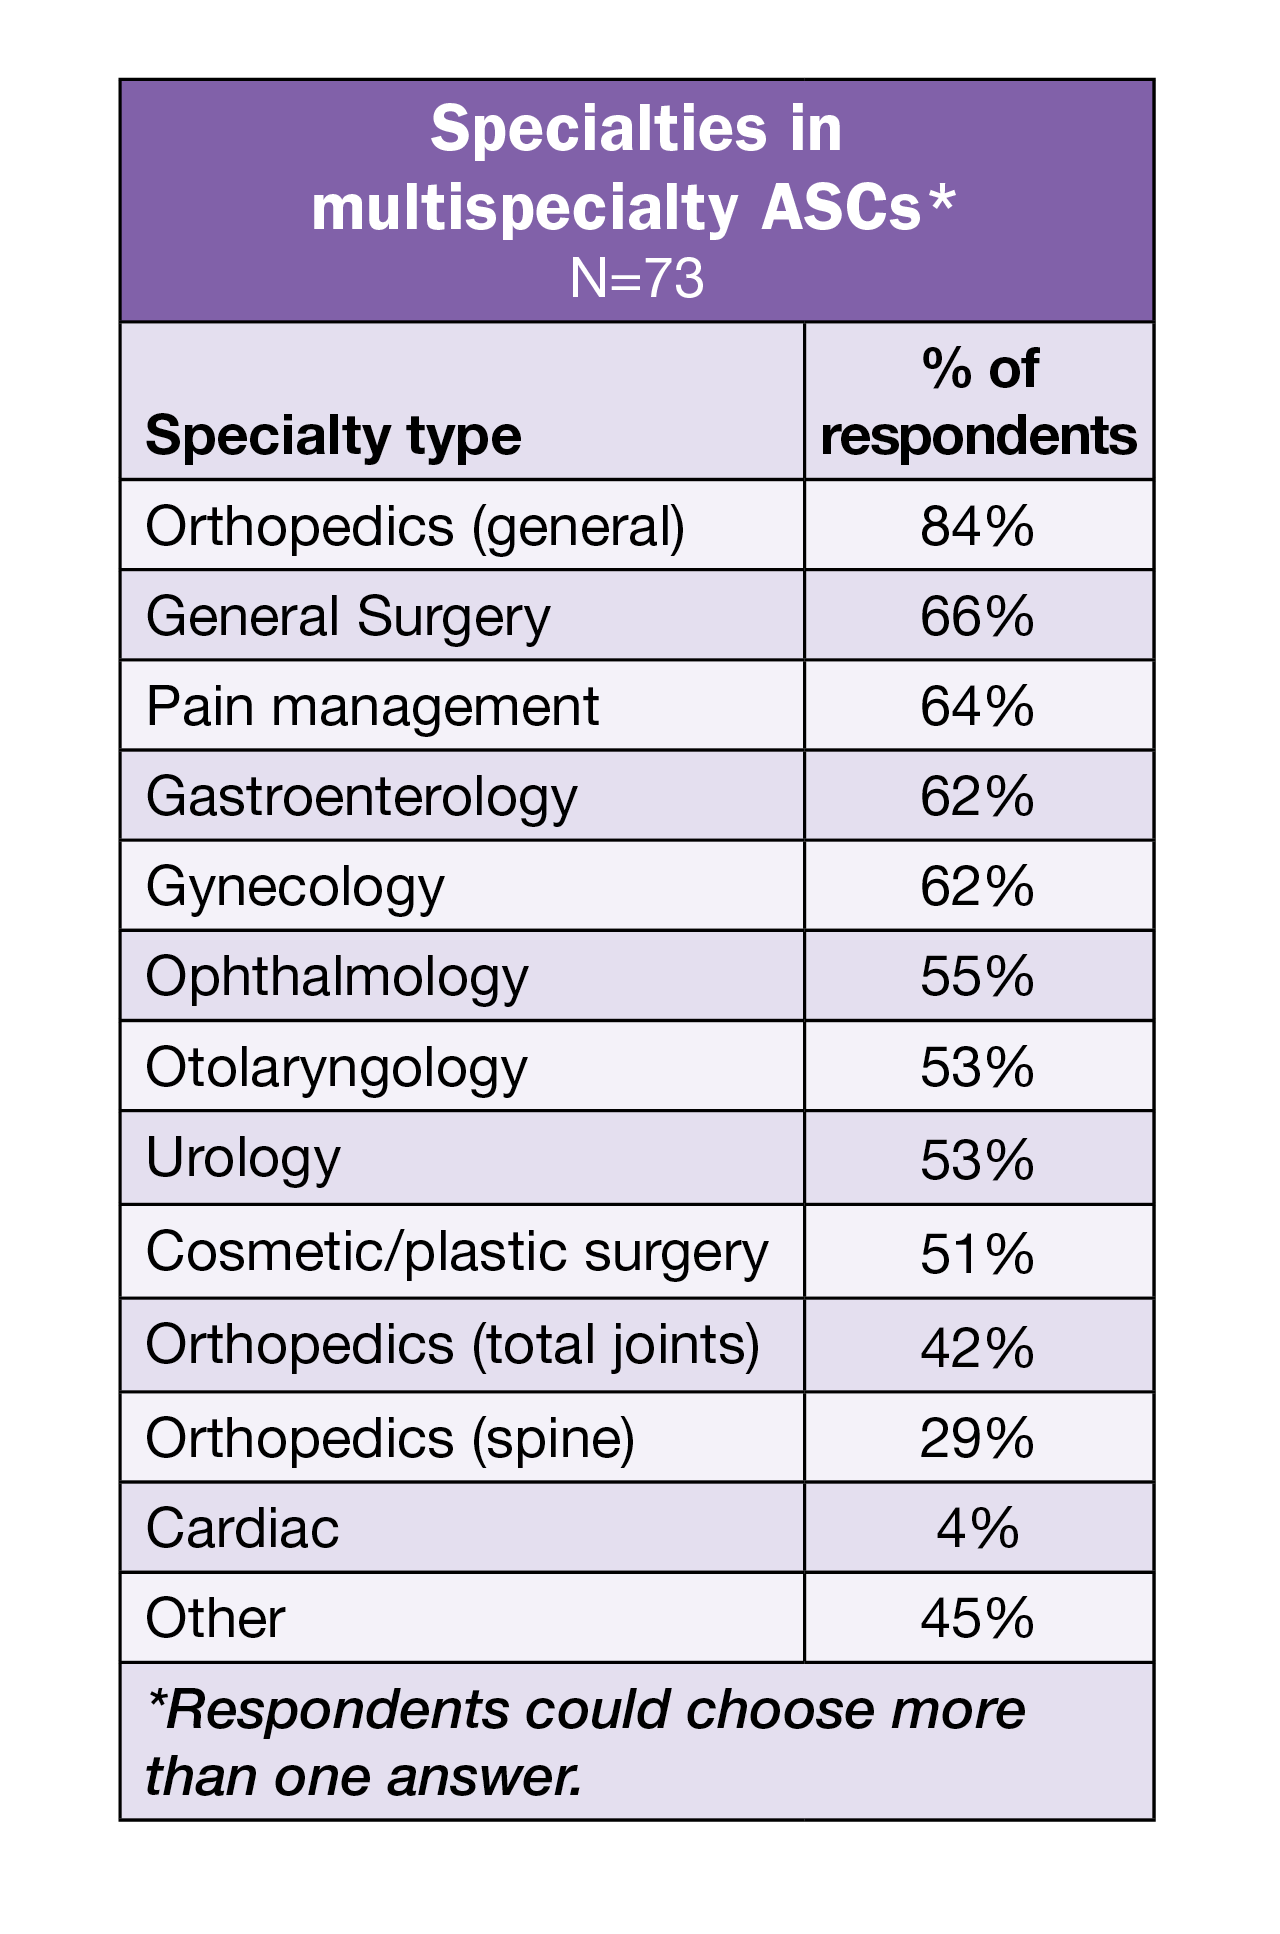
ASC leaders who work in multispecialty ASCs were asked to choose the specialties their facility offers. Orthopedics topped the list, with 84% selecting general orthopedics, 42% selecting total joints, and 29% selecting orthopedics (spine). Other specialties receiving more than a 60% response rate were general surgery (66%), pain management (64%), gastroenterology (62%), and gynecology (62%). Podiatry was the most cited specialty not on the list of options.
As in 2021 and 2022, ophthalmology was the most common single specialty (40%). The next two most common were orthopedics (24%) and gastroenterology (18%). No other specialty received more than 6%.
Although most respondents reported an increase in surgical volume over the past 12 months, 16% reported a decrease (vs 10% in 2022), and 27% noted it remained about the same. The average number of surgical procedures (including endoscopies) was 5,541, up from 4,242 last year and comparable to 5,115 in 2019. (The 2023 average omits an outlier figure of 300,000).
Pondering productivity
Maximizing productivity has always been vital in the ASC, but increased volumes and staffing challenges have driven its importance to new levels. We asked ASC leaders to share challenges associated with measuring productivity.
A common theme among the 101 comments related to difficulties in obtaining useful data, which some respondents attributed to the nature of the ASC setting. Sample comments in this area include:
“Does not take into account challenging patients or more complex procedures or physicians that take more time to do cases.”
“Difficult to calculate specific time needed to complete non-direct patient care tasks or non-procedure day processes for schedule daily...”
Obtaining useful data also was reported as a challenge, as indicated in these comments:
“Accuracy of data depends on EMR [electronic medical record] charting. Some data points require manual calculation…”
“Reports are only as accurate as the info that is input into the computer.”
Other issues raised by respondents included lack of time to analyze the data, difficulty in finding relevant comparison sources, volume variations, and inadequate software.
One ASC leader summed up the issue this way: “There are several challenges associated with measuring productivity in any setting, including healthcare. Some common challenges include difficulty in defining and standardizing work tasks: Measuring productivity requires defining specific tasks to be measured. However, tasks may vary in complexity, duration, and impact on outcomes, making it hard to create standardized measures.”
Read more about ASC productivity measurement in the November/December 2023 issue of OR Manager.
As surgical volume continues to rise, ASC leaders are faced with persistent staffing challenges. Given the financial pressures in healthcare and a workforce that will take time to return to prepandemic levels, leaders will need to call on all their skills to lead their teams in delivering safe patient care. ORM
—Cynthia Saver, MS, RN, is president of CLS Development, Inc, Columbia,
Maryland, which provides editorial
services to healthcare publications.
Reference
NSI national healthcare retention & RN staffing report. NSI Nursing Solutions. 2023. https://www.nsinursingsolutions.com/Documents/Library/NSI_National_Health_Care_Retention_Report.pdf
Survey: Dip in satisfaction with little change in compensation
By Cynthia Saver

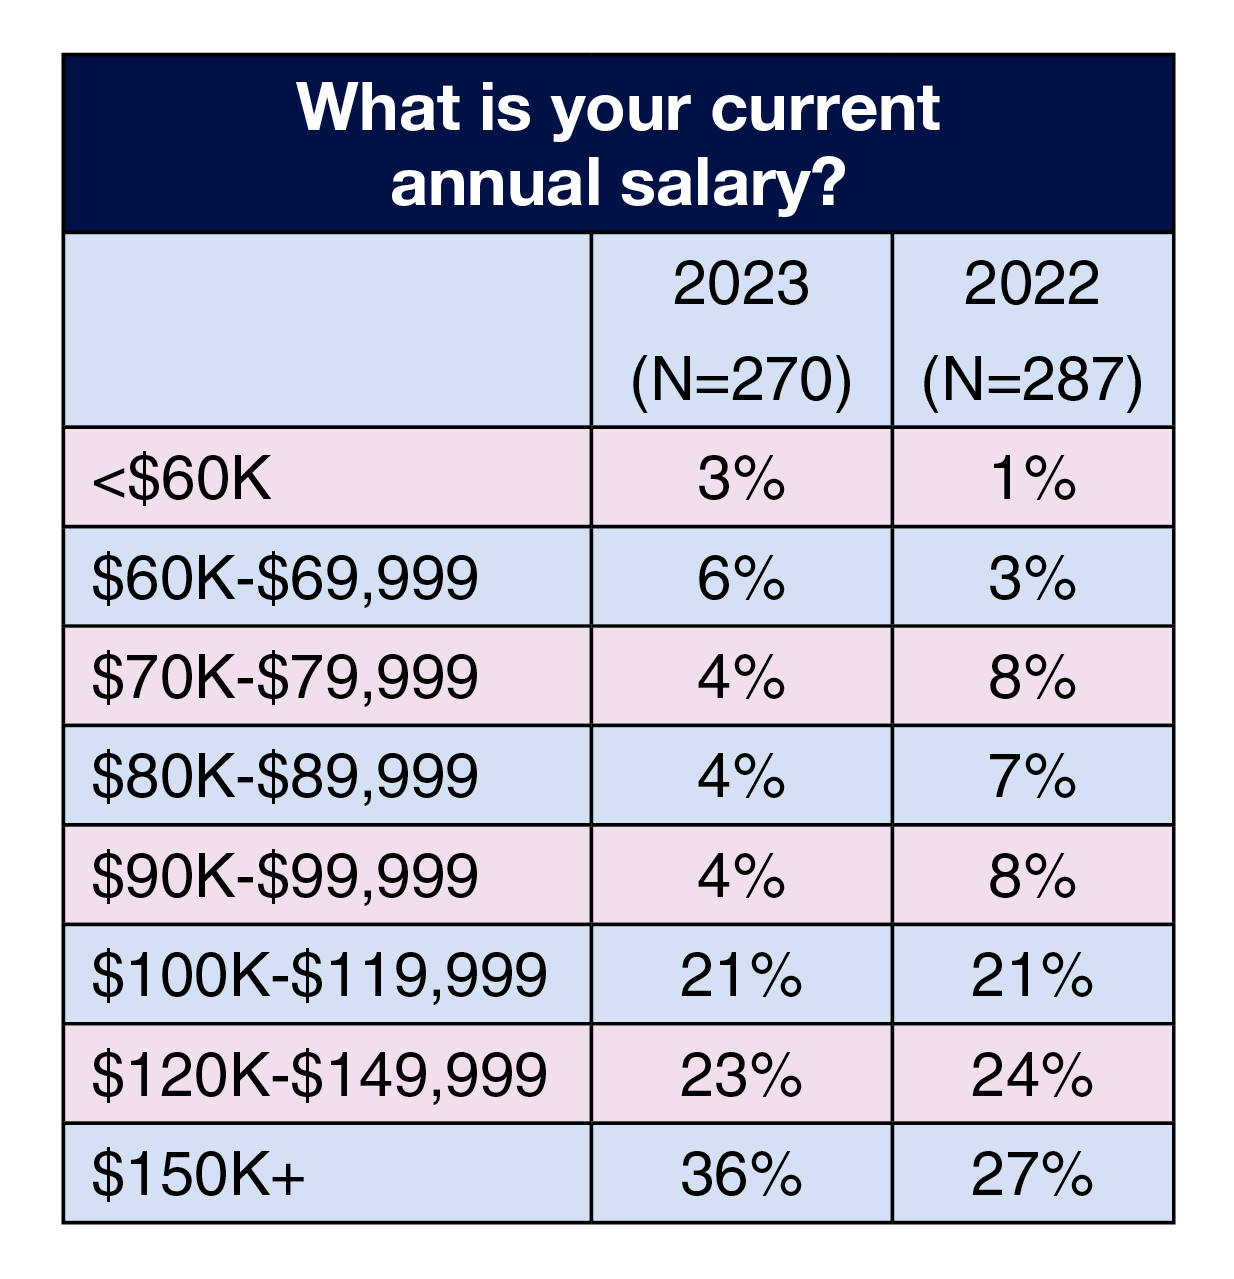
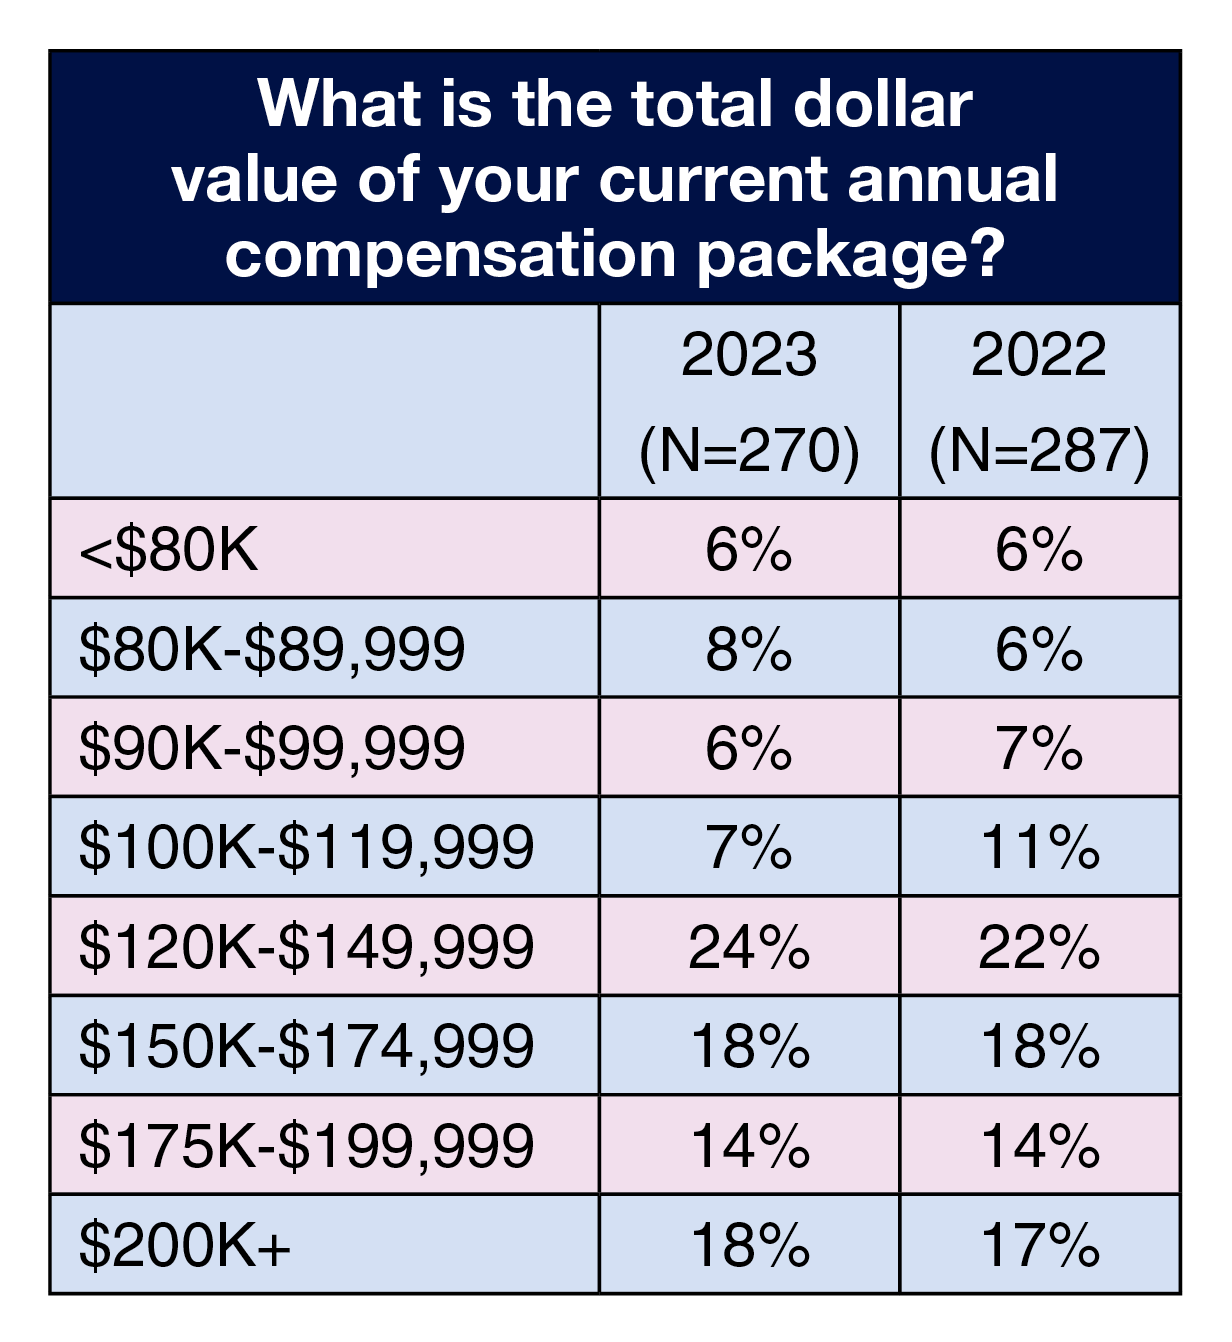
In an era where the changing landscape of healthcare is placing enormous strain on OR leaders, compensation has increased only slightly, according to the 2023 OR Manager Salary/Career Survey. More than one-third (36%) of respondents earn $150,000 or more, up from 27% last year, but only slightly higher than 2021’s 31%. In addition, only 18% of respondents earn $200,000 or more in total compensation, comparable to last year’s 17%. For most OR leaders, it is unlikely that any increase has kept pace with inflation.
That may be part of the reason why satisfaction dipped this year. Nearly two-thirds (64%) of respondents view their current job favorably, but that is down from 72% in 2022 and equals 2021’s figure.
Other key survey findings include:
- Only 39% of respondents plan to stay with their current employer 5 years or more, down from 45% in 2022, and more than a third (36%) plan to stay 2 years or less, up from 27% last year.
- The average number of full-time equivalent (FTE) employees that OR leaders supervise is 114, compared to 113 in 2022 and 119 in 2021.
- The percentage of those who report managing an operating budget between $2.5 million and $24.9 million is 43%, comparable to last year’s 46%.
This article takes a closer look at findings related to hospital OR leaders. (Percentages may not add up to 100% due to rounding.)

Compensation
Compensation for most OR leaders has not changed significantly this past year. Slightly more leaders received a raise in the past 12 months, compared to 2022 (70% vs 63%). The average raise was 3.8% (far lower than the 2022 consumer price index of 6.5%), compared to 4.1% in 2022 and 3.3% in 2021.
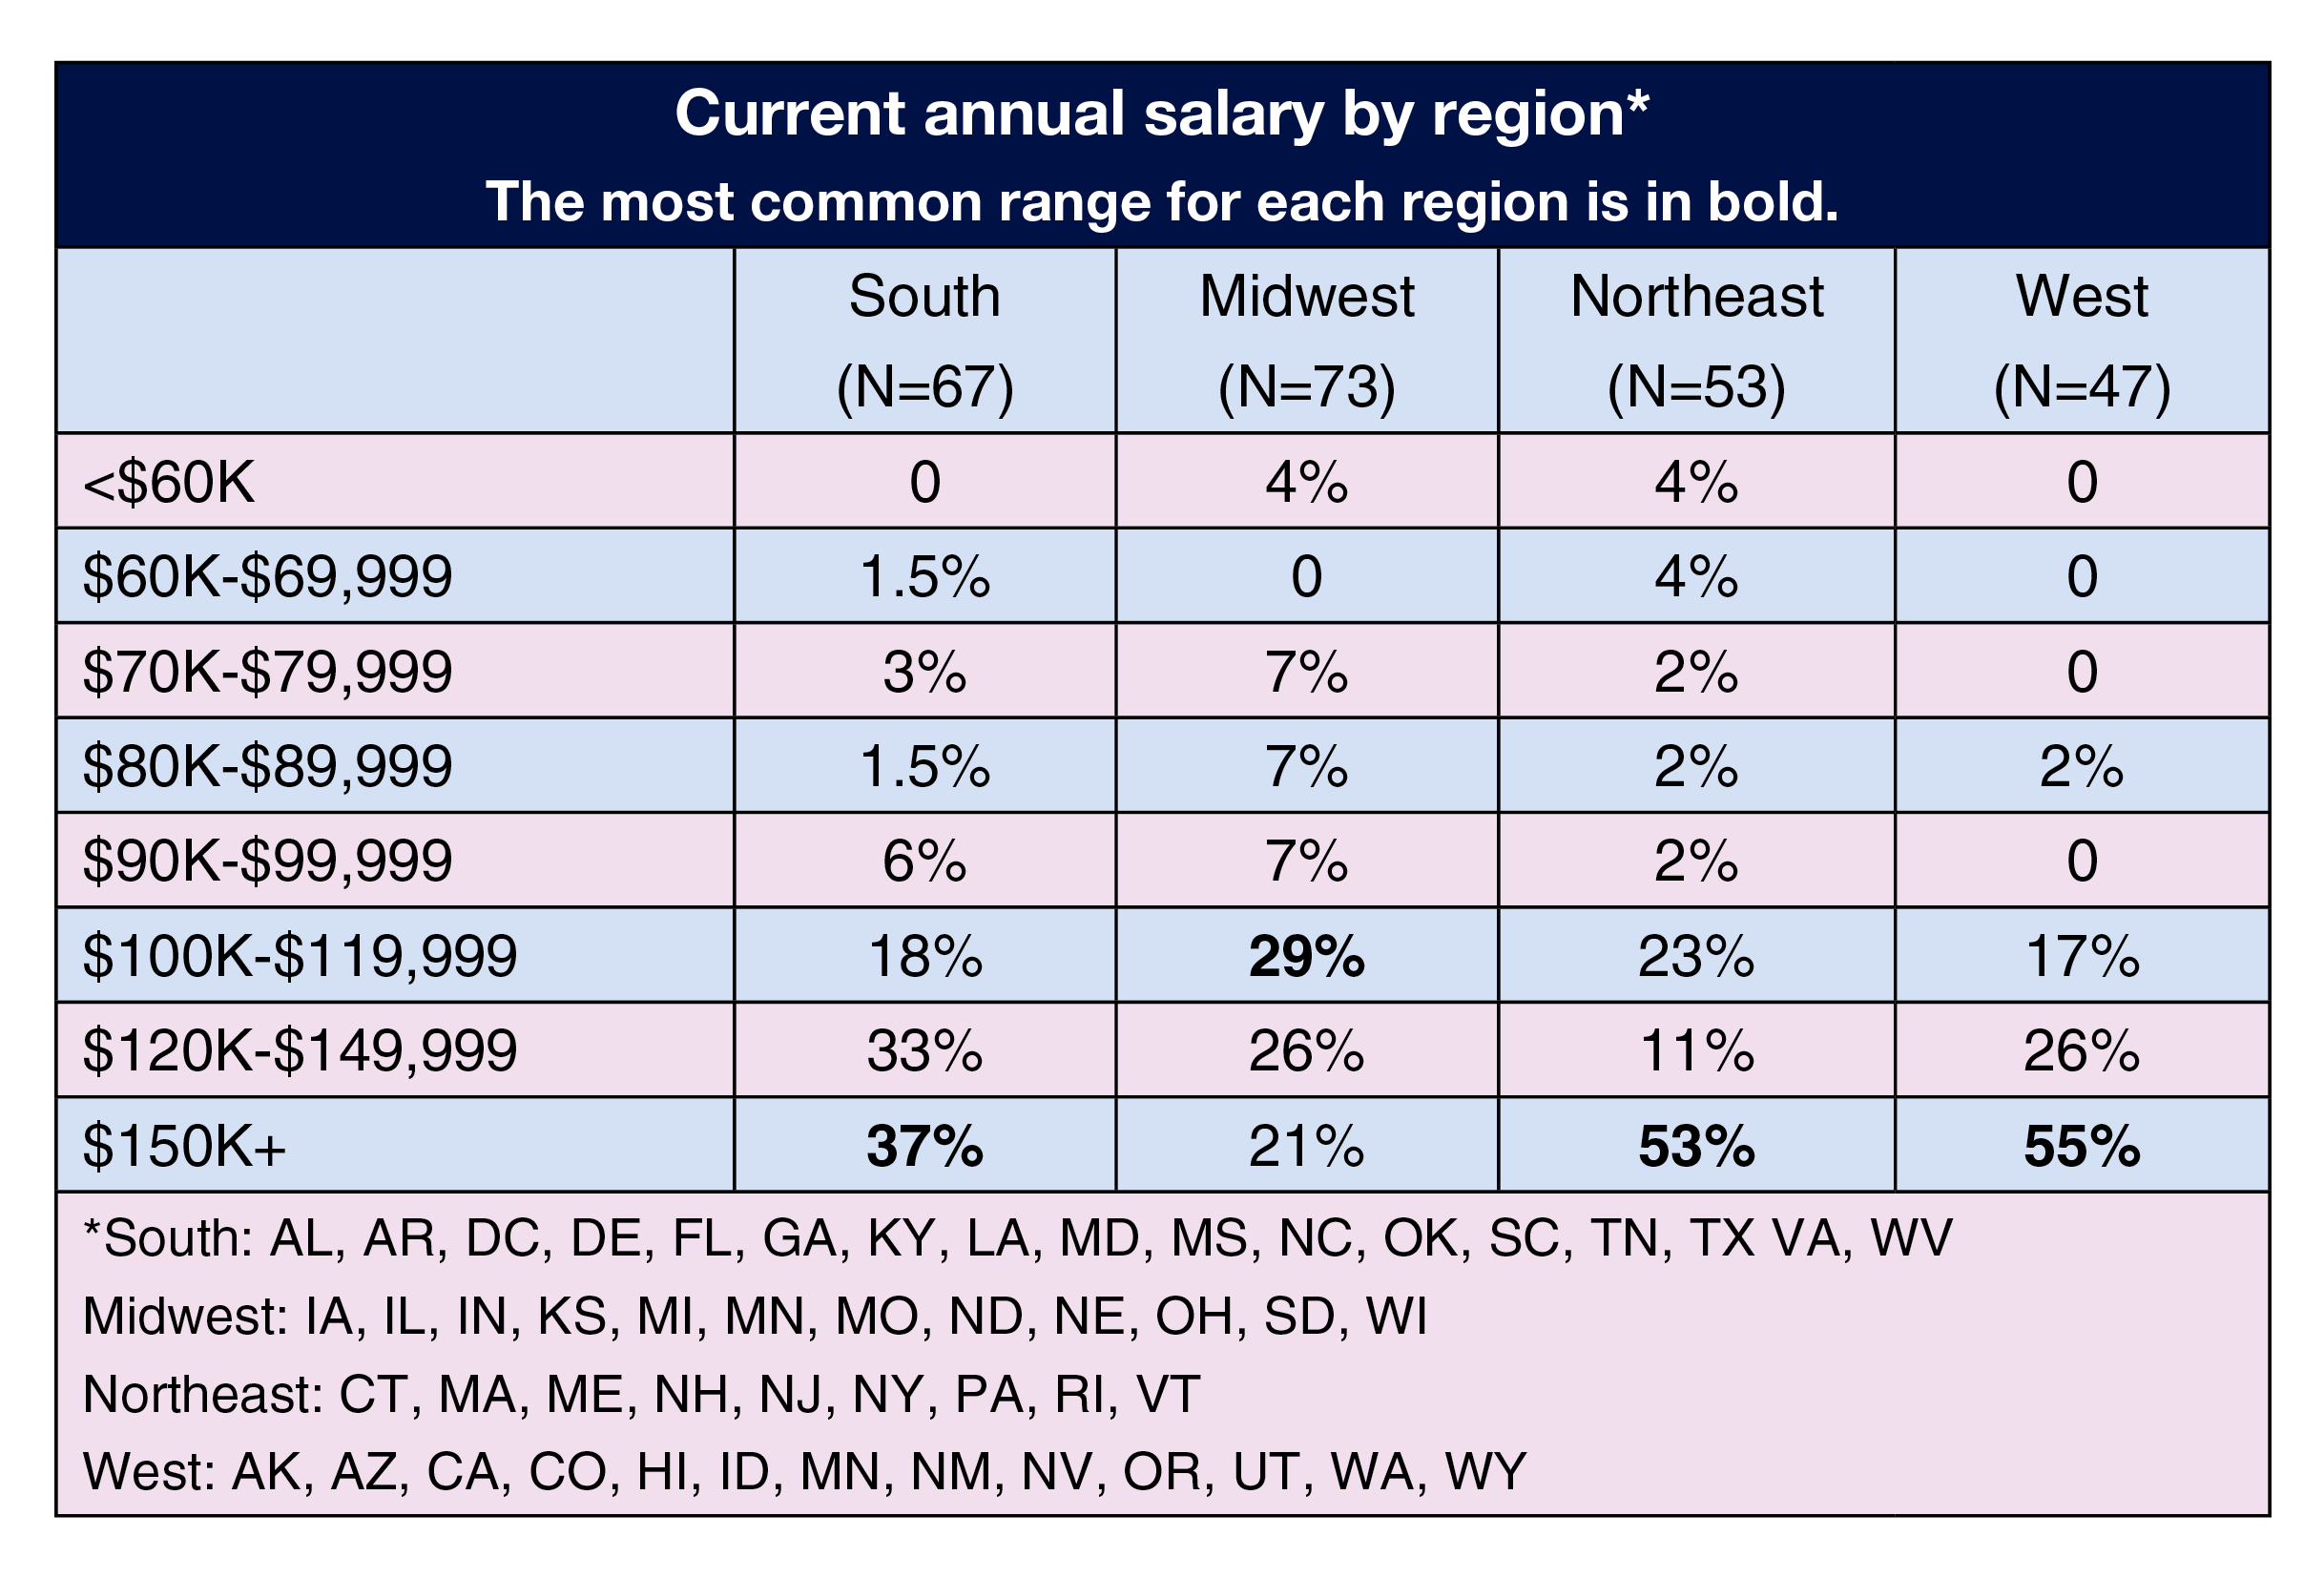
Salary. Salaries were only slightly higher this year, with 80% reporting an annual salary of $100,000 or more, up from 72% last year and 78% in 2020 and 2021. Variations were seen by job title, region, and type of facility.
The most common salary range by job title was $150,000 or more for vice president or chief nurse executive (72%), administrator or administrative director (47%), and director or assistant director (48%). Most nurse managers (37%) selected $100,000 to $119,999.
Across regions, the most common salary range was $150,000 or more for respondents in the West (55%), Northeast (53%), and South (37%); it was $100,000 to $119,999 for those in the Midwest (29%).
OR leaders in teaching hospitals earn more than those in community hospital settings. Close to half (45%) of teaching hospital leaders earn an annual salary of $150,000 or more, compared to 28% for community hospital leaders. In all, 89% of respondents in teaching hospitals earn $100,000 or more, compared to 75% for those in community hospitals.
Total compensation. Annual total compensation remained relatively flat. The most reported range was the same as last year—$120,000 to $149,000 (24% for 2023 vs 22% for 2022)—followed by $150,000 to $174,999 and $200,000 or more (18% for both). As with salary, variations were seen by job title, region, and facility type.
Most common range for total compensation by job title was $200,000 or more for vice president or chief nurse executive and for administrator or administrative director (40% and 41%, respectively), $150,000 to $174,999 for director or assistant director (25%; another 22% reported between $175,000 and $199,999) and $120,000 to $149,999 for nurse manager (40%).
The most common total compensation range for those in the Midwest, South, and Northeast was $120,000 to $149,999 (28%, 28%, and 26%, respectively). Most respondents who live in the West (32%) earn between $150,000 and $174,999.
As with salary, OR leaders in teaching hospitals earn more in total compensation than their community hospital counterparts. One-quarter of OR leaders in teaching hospitals earn $200,000 for more, nearly double the 13% for those in community hospitals; 60% of teaching hospital leaders earn $150,000 or more, compared to 43% for respondents in community hospitals.
Span of control
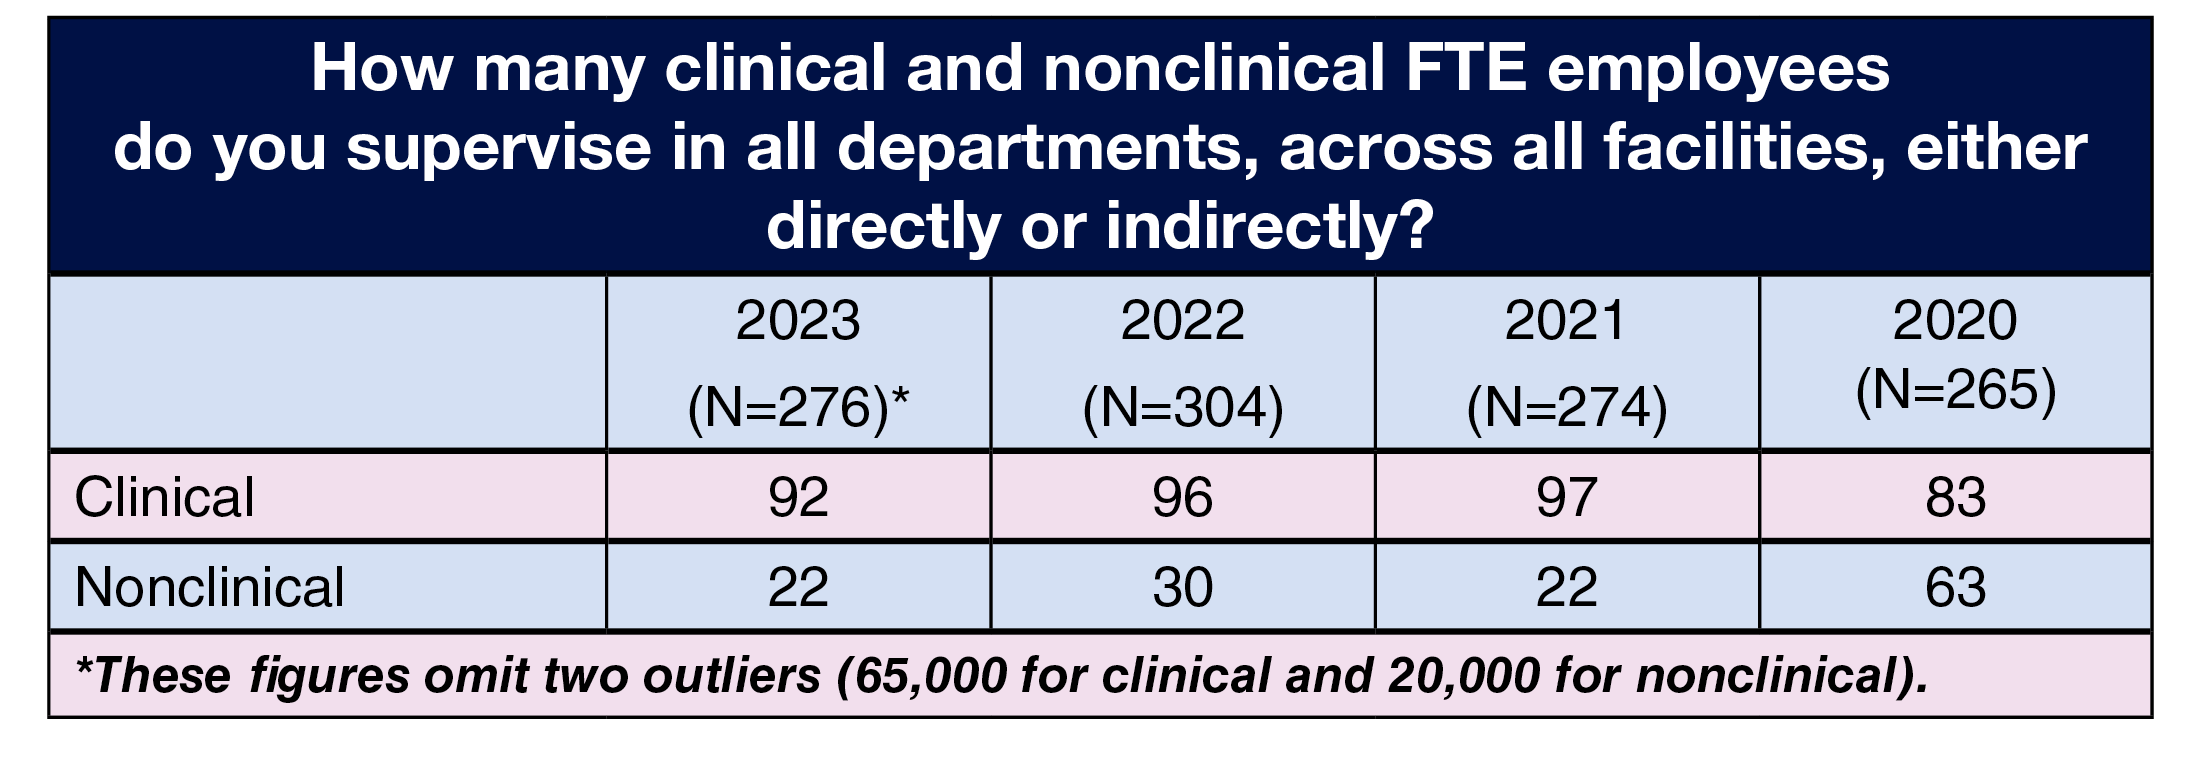
OR leaders supervise an average of 92 clinical FTE positions, slightly less than the 96 in 2022 and 97 in 2021. They supervise an average of 22 nonclinical positions, down from 30 last year, but the same as in 2021.
For the most part, the number of ORs that leaders oversee has been consistent over the past 3 years. This year, most respondents (29%) oversee one to five ORs, and another 25% are in charge of six to 10 ORs; both percentages are unchanged from 2022. In addition, 15% are responsible for 11 to 15 ORs, and 13% for 16 to 20 ORs. Only 8% oversee more than 35, up from last year’s 5%.
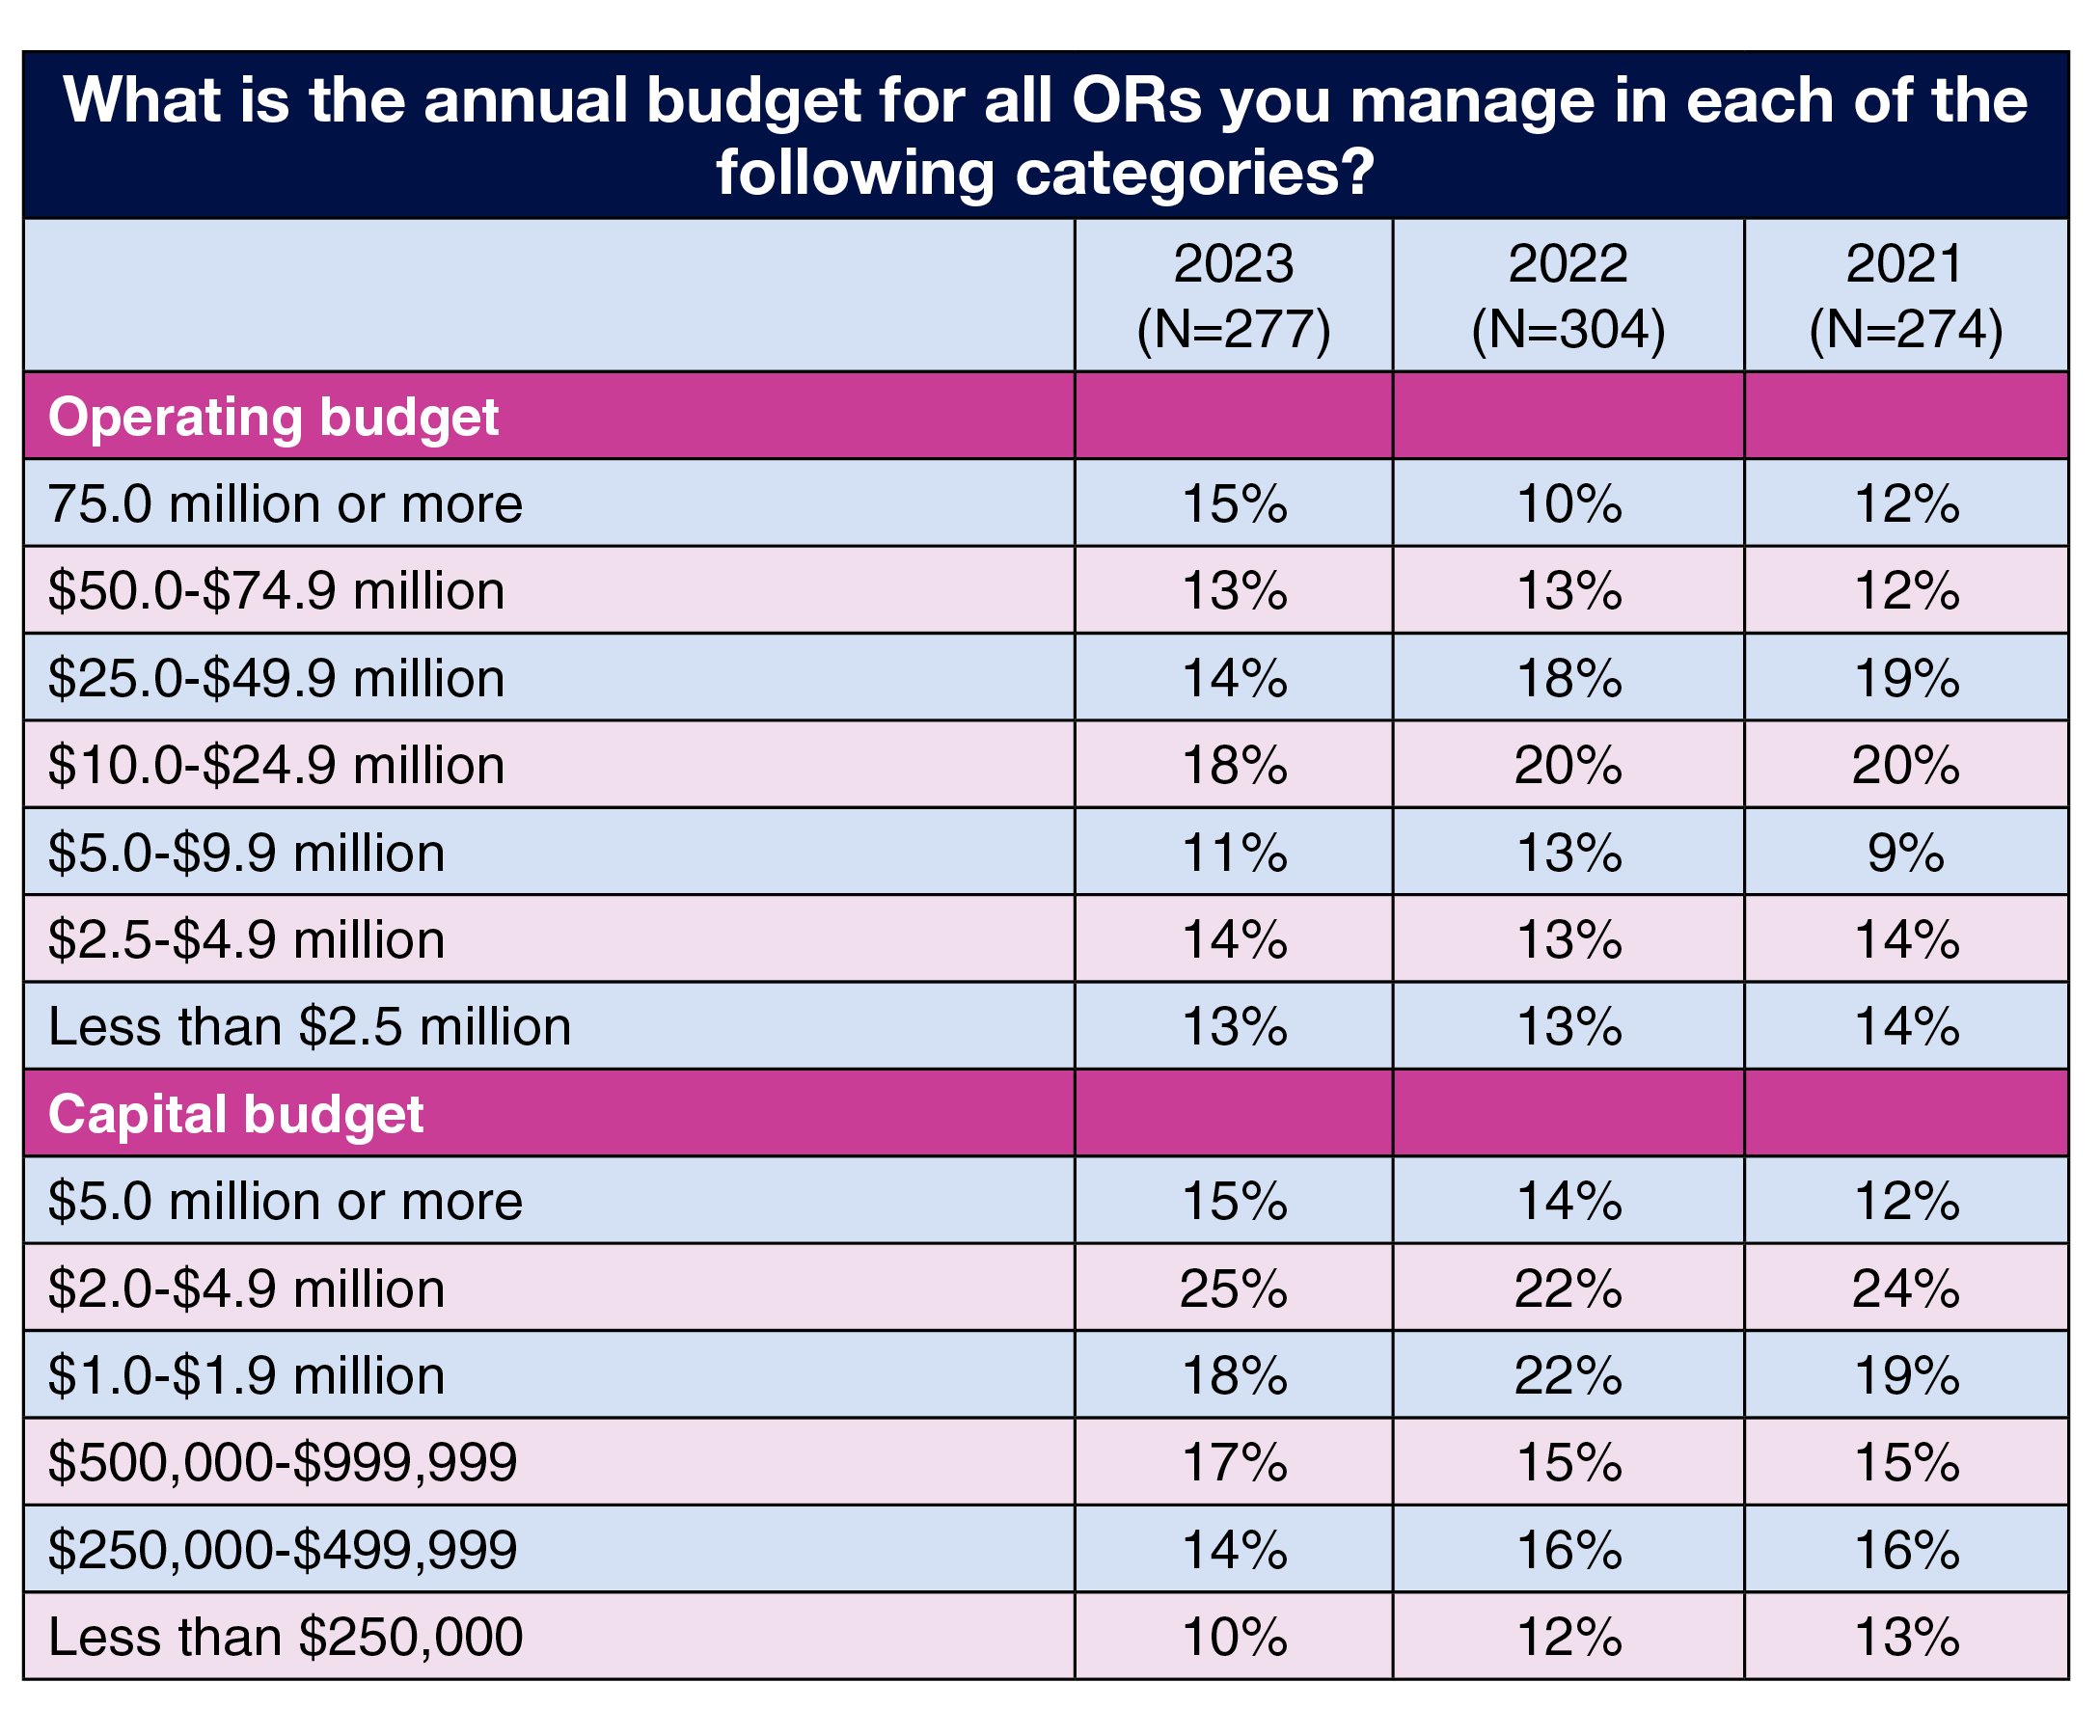
Budget responsibilities remain relatively stable. For example, this year, 28% of OR leaders reported managing an operating budget of $50 million or more, up slightly from 23% in 2022 and 24% in 2021. Nearly a third (32%) manage an operating budget of $10 million to $49.9 million, down slightly from 38% in 2022 and 39% in 2021.
Stability extended to the capital budget. In all, 40% of respondents oversee a budget of $2 million or more, compared to 36% for both 2022 and 2021. Only 24% manage a budget of $499,999 or less, compared to 28% last year and 29% in 2021.
OR leaders at work
Although many OR leaders still view their job favorably, satisfaction was slightly lower this year. The 64% favorability rating is much lower than the prepandemic figure of 70% in 2019. However, the unfavorable rating remained low this year, although up from 2022 (11% vs 7%).
Satisfaction also decreased in two other areas—total compensation and benefits. Less than half (42%) of respondents gave a favorable rating for compensation, down from 51% last year, and the favorable rating for benefits dropped from 64% in 2022 to 56% this year. In addition, satisfaction with top leadership and support provided by the respondent’s boss were both slightly lower than last year.
One area with a significant increase was patient satisfaction with OR services. As in past surveys, this received the highest satisfaction rating (84%, up from 76% in 2022).
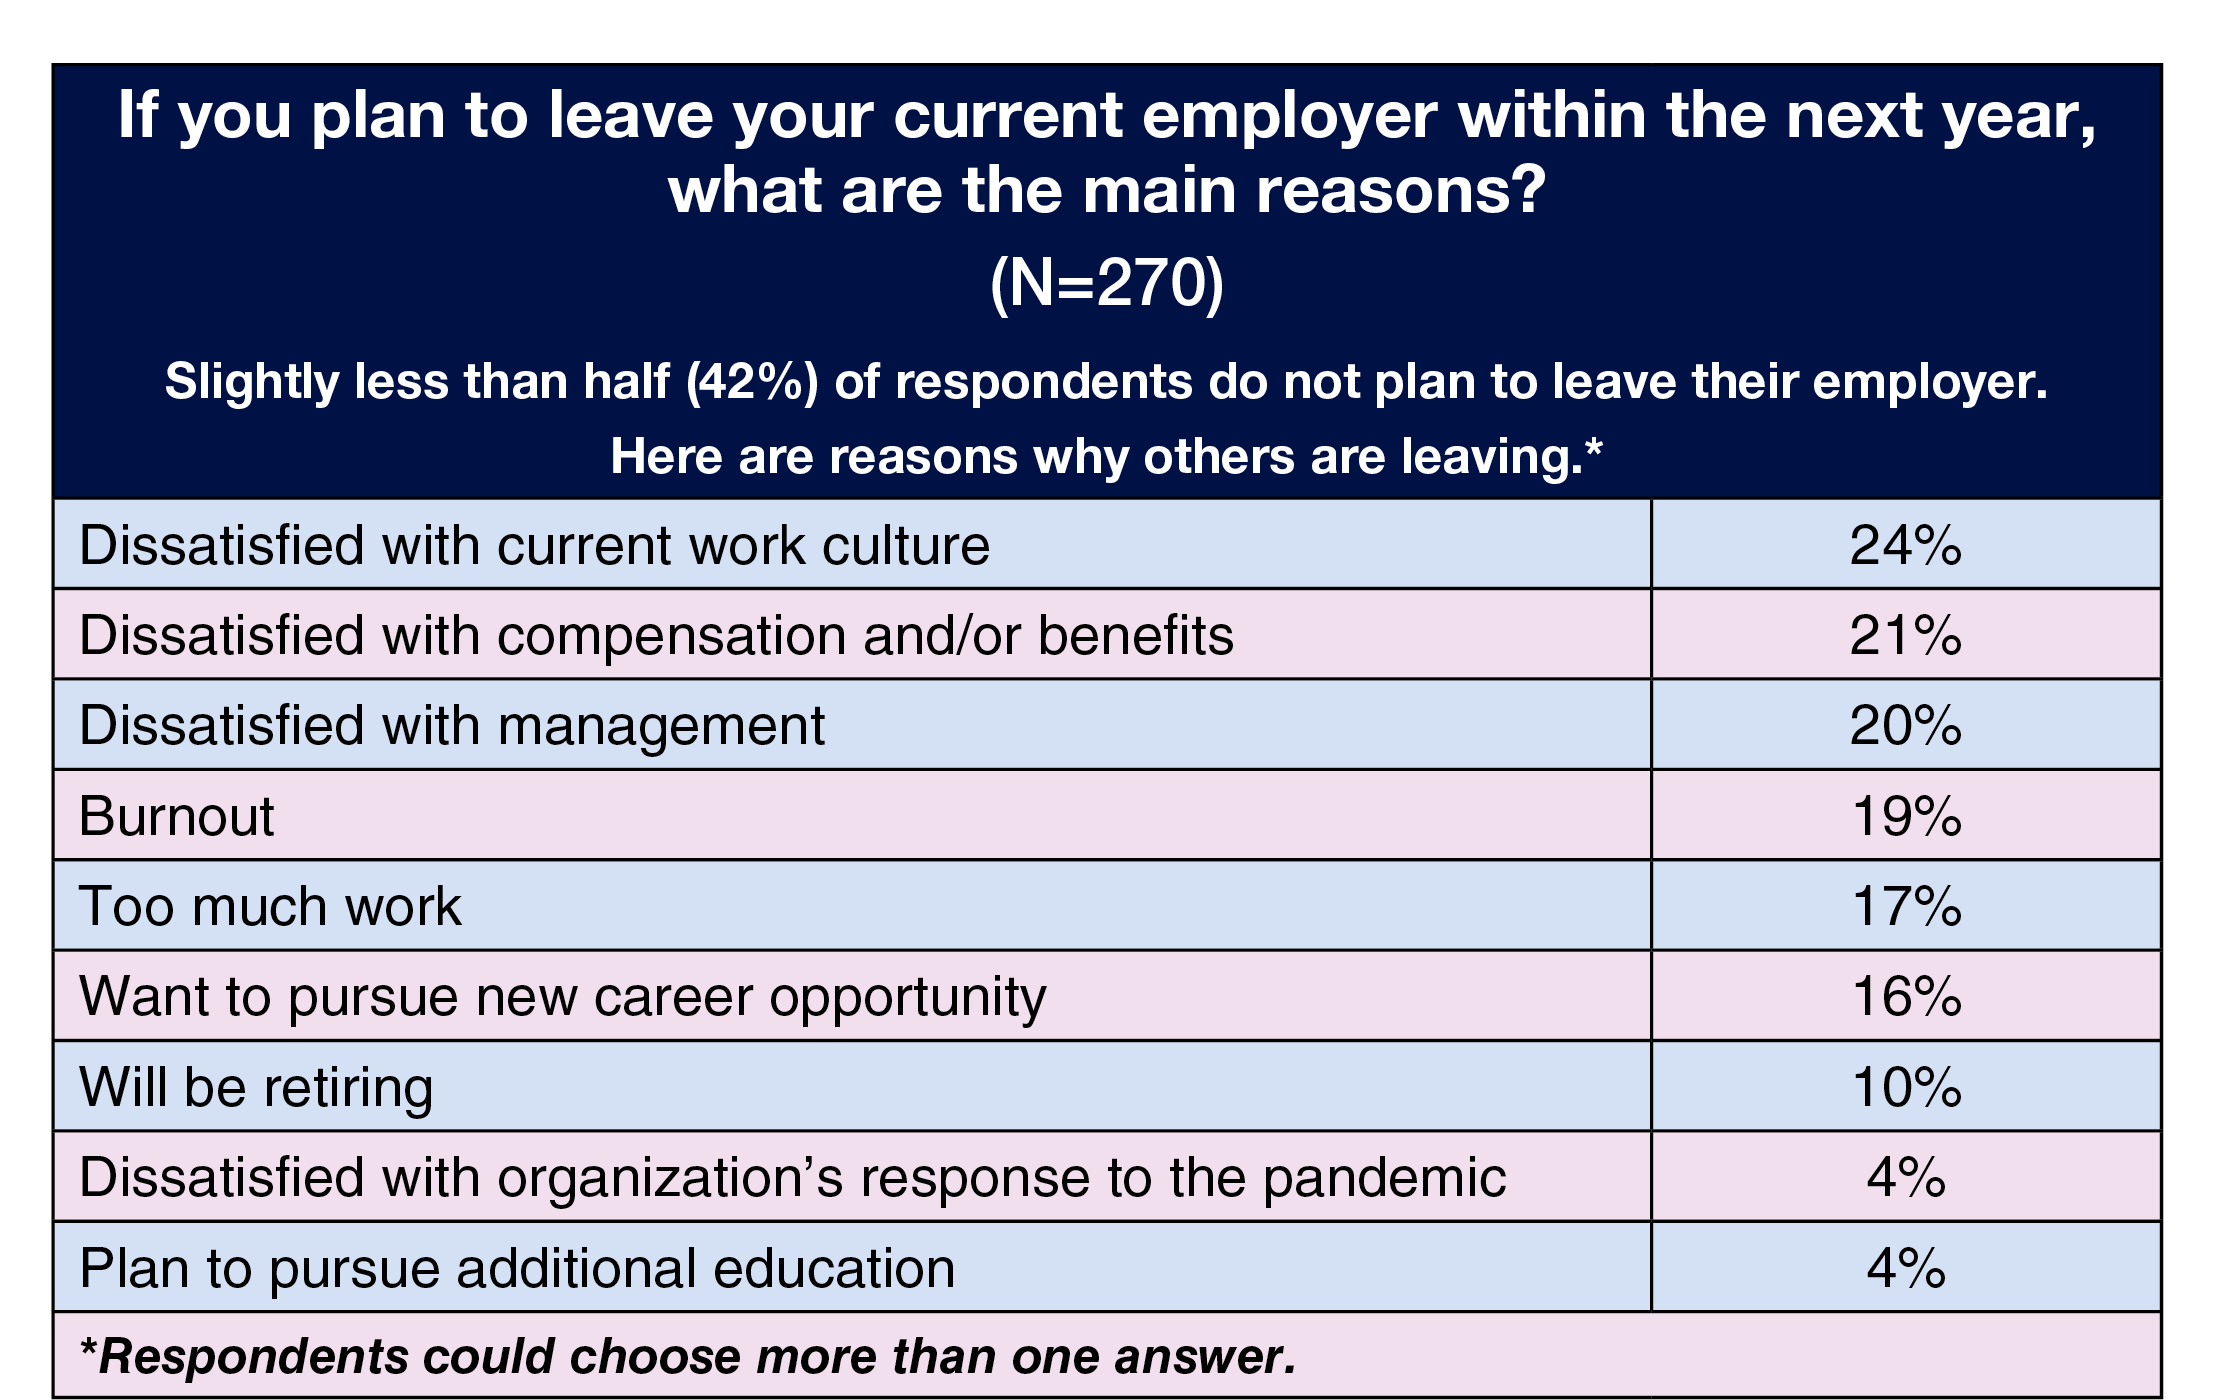
Nearly half of respondents (42%) do not plan to leave their current employer in the next year. The top three reasons for leaving (respondents could choose more than one answer) were dissatisfaction with: current work culture (24% vs 18% in 2022), compensation and/or benefits (21% vs 16% in 2022), and management (20% vs 13% in 2022).
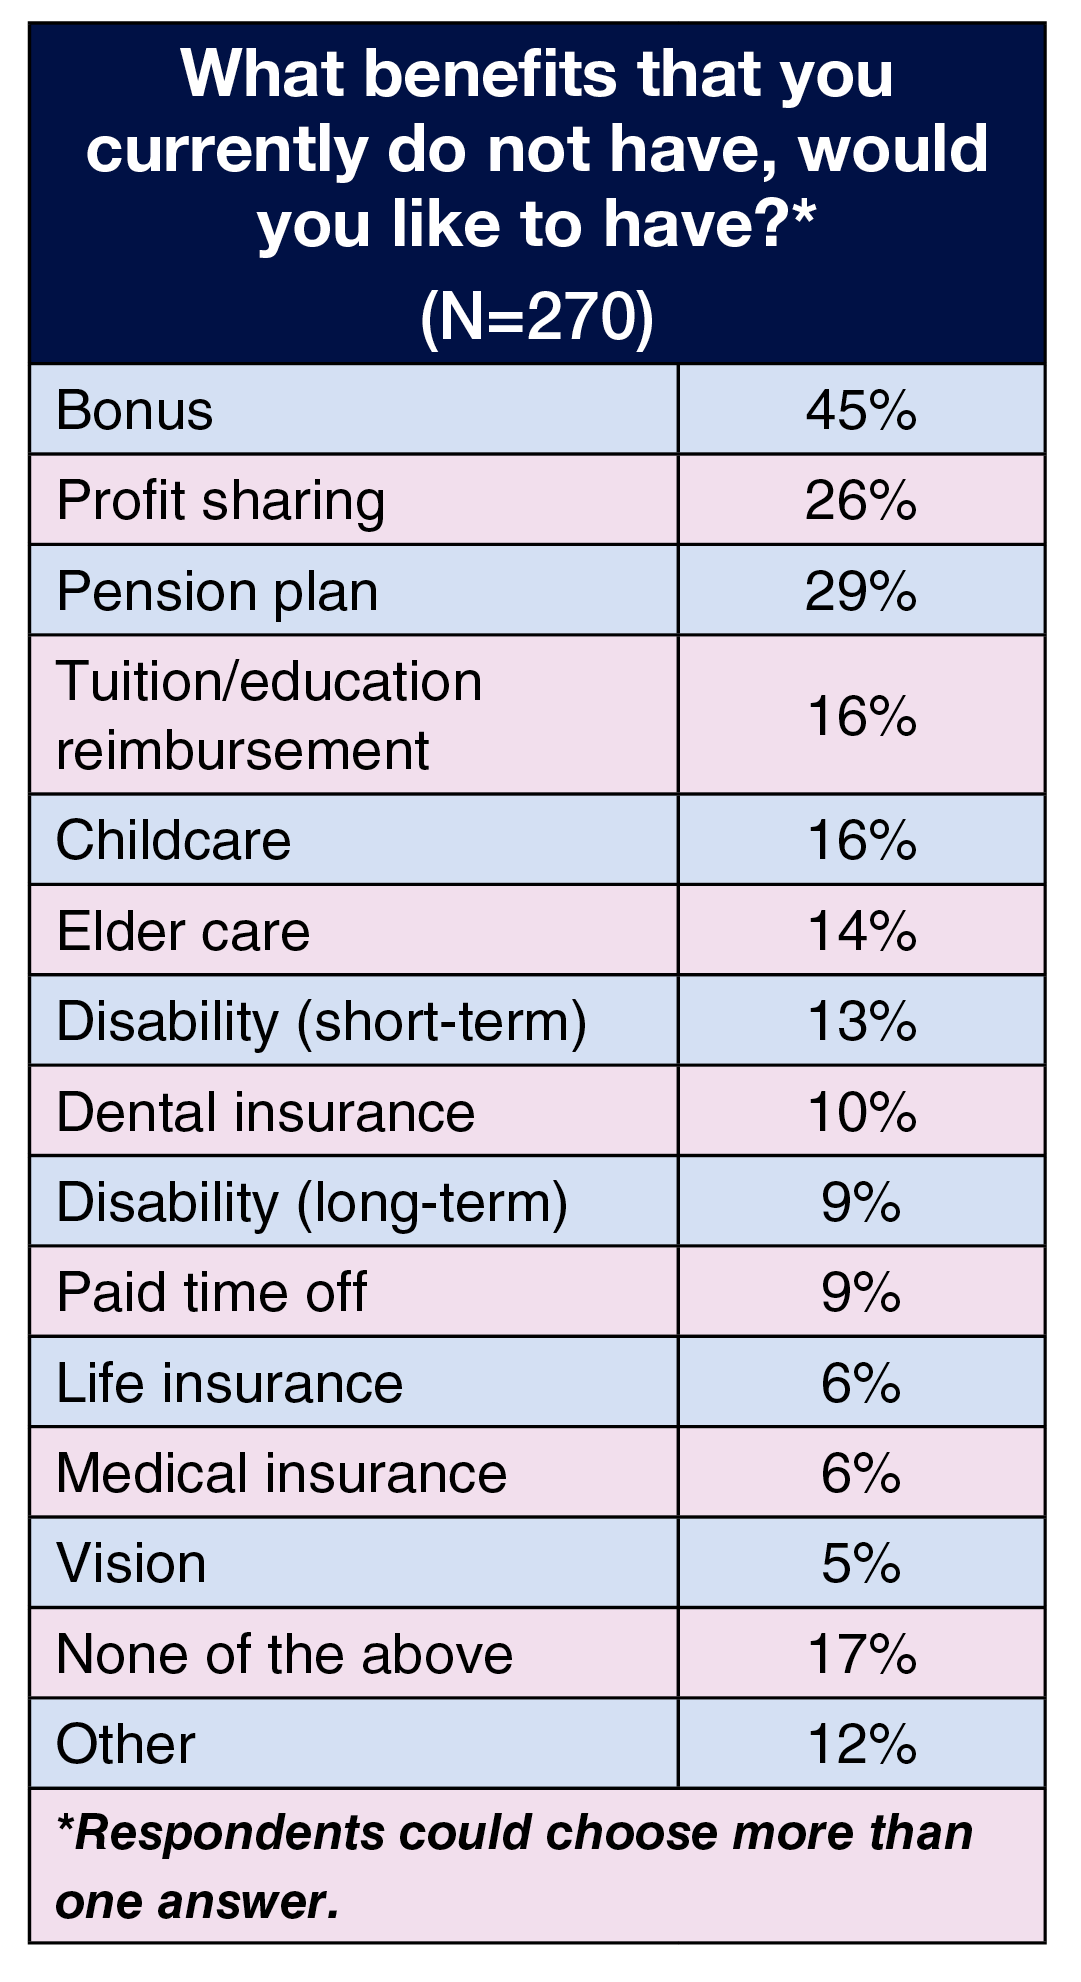
Benefits can play a key role in retention, so we asked respondents to select from a list the benefits they would like to receive if they did not currently have them. Consistent with past survey results, money-related benefits were the top three (respondents could choose more than one option). A bonus topped the list, increasing from 35% last year to 45% this year. Profit sharing took the number two slot (26% this year and last), followed by a pension plan (29%, up from 22% in 2022). Respondents suggested other benefits not on our list, such as a sabbatical, free parking, loan debt forgiveness, and health insurance after retirement.
OR leader profile
The infographic on page 15 illustrates some of the overall demographics for respondents. The average age of OR leaders who responded to this year’s survey is 51, compared to 49 last year and 53 in 2021. The average age of an RN is 46, according to The 2022 National Nursing Workforce Survey.
The most common job titles among respondents were nurse manager (40%) and director/assistant director (39%), followed by administrator/administrative director (12%), and vice president/chief nurse executive (8%).
As a group, OR leaders continue to lack diversity. Most respondents (82%) chose White as their race or ethnicity, followed by African American/Black (6%), Asian and Hispanic/Latinx (3% for each), and American Indian/Alaska Native (2%). No respondent chose Native Hawaiian/Other Pacific Islander.
The most reported highest degree remained the Master of Science or Master of Science in Nursing (38%, up slightly from 30% in 2022), with an additional 14% reporting another master’s degree. The downward trend of a baccalaureate degree as the highest level of education continued (26% this year, vs 31% in 2022, 36% in 2021, and 45% in 2020). The percentage of respondents having a doctorate degree increased from 8% in 2022 to 13% this year.
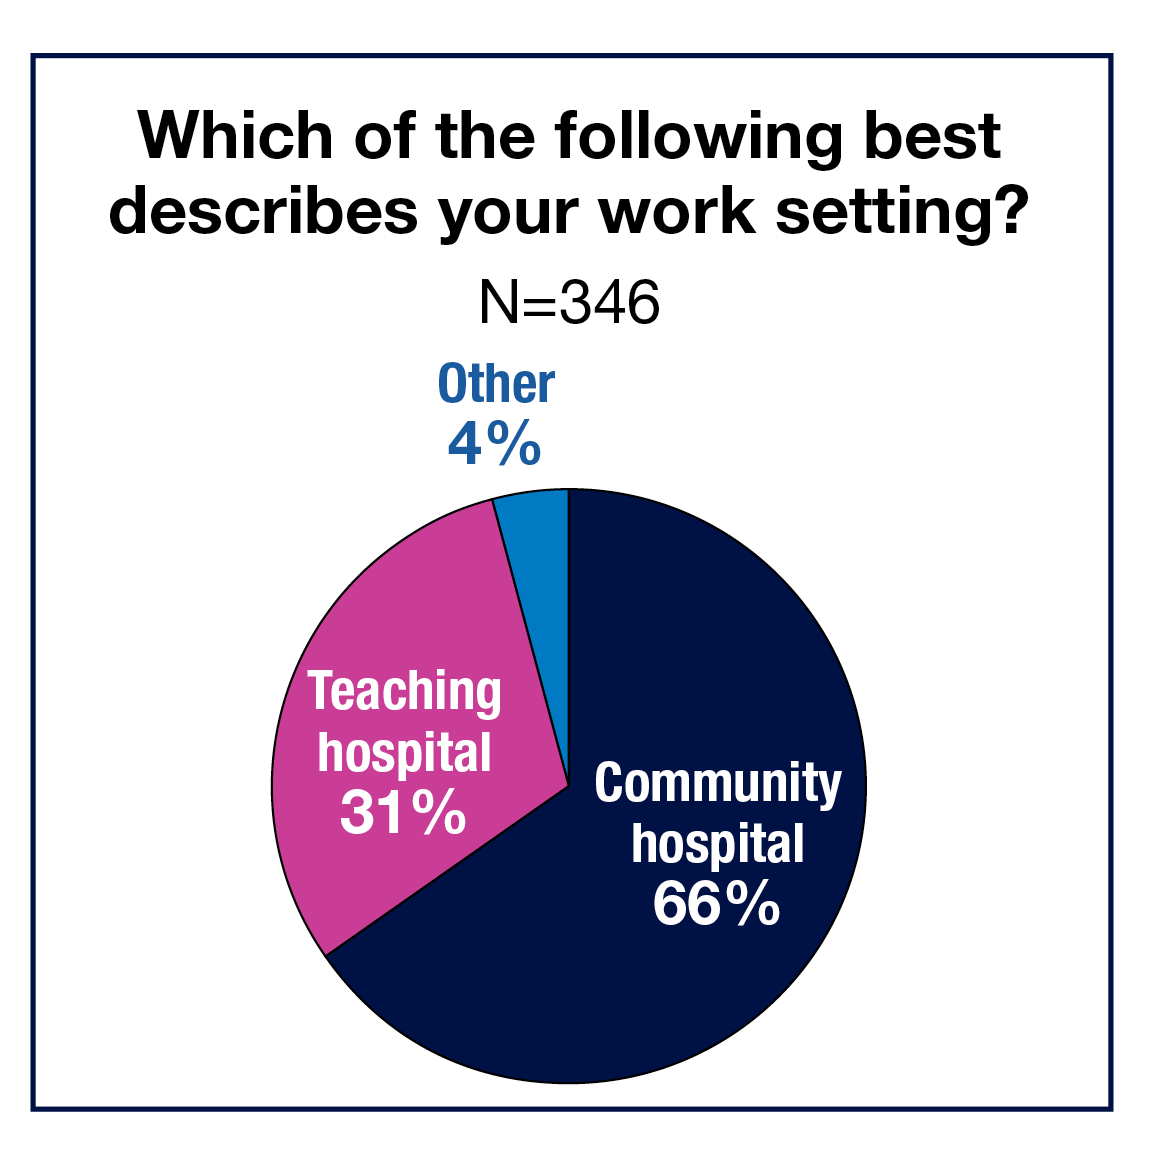
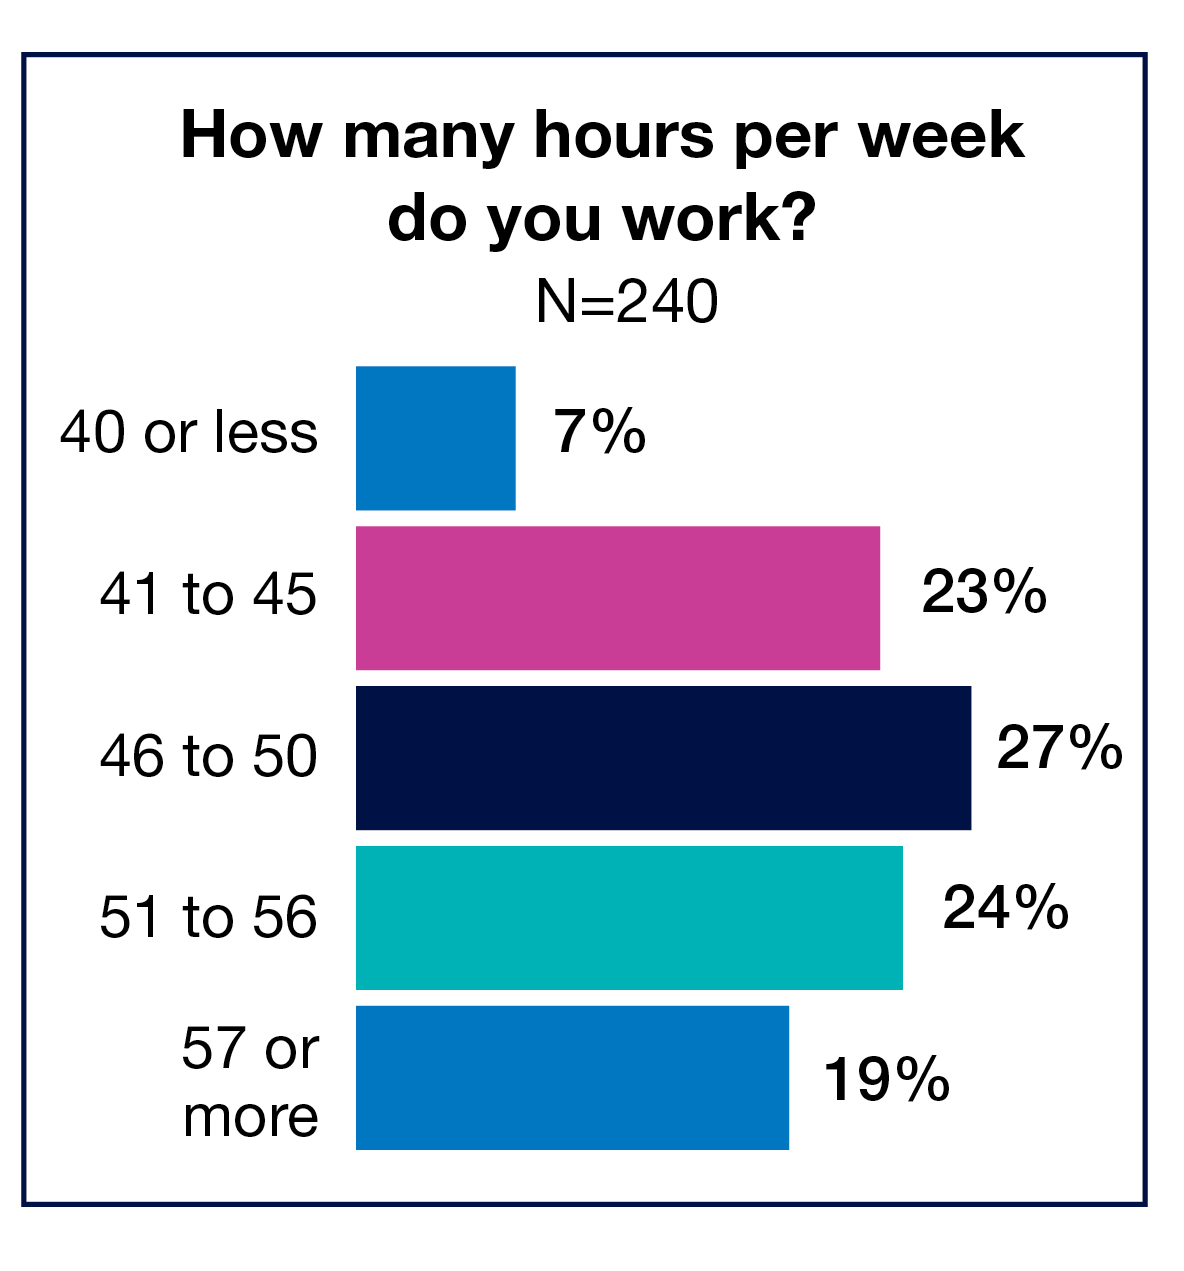
Most respondents live in the Midwest (30%) or the South (28%), followed by the Northeast (22%) and West (20%). The work destination for two-thirds of the OR leaders (66%) is a community hospital, with 31% travelling to a teaching hospital. Only 7% spend 40 hours or less at work, and 19% spend 57 hours or more.
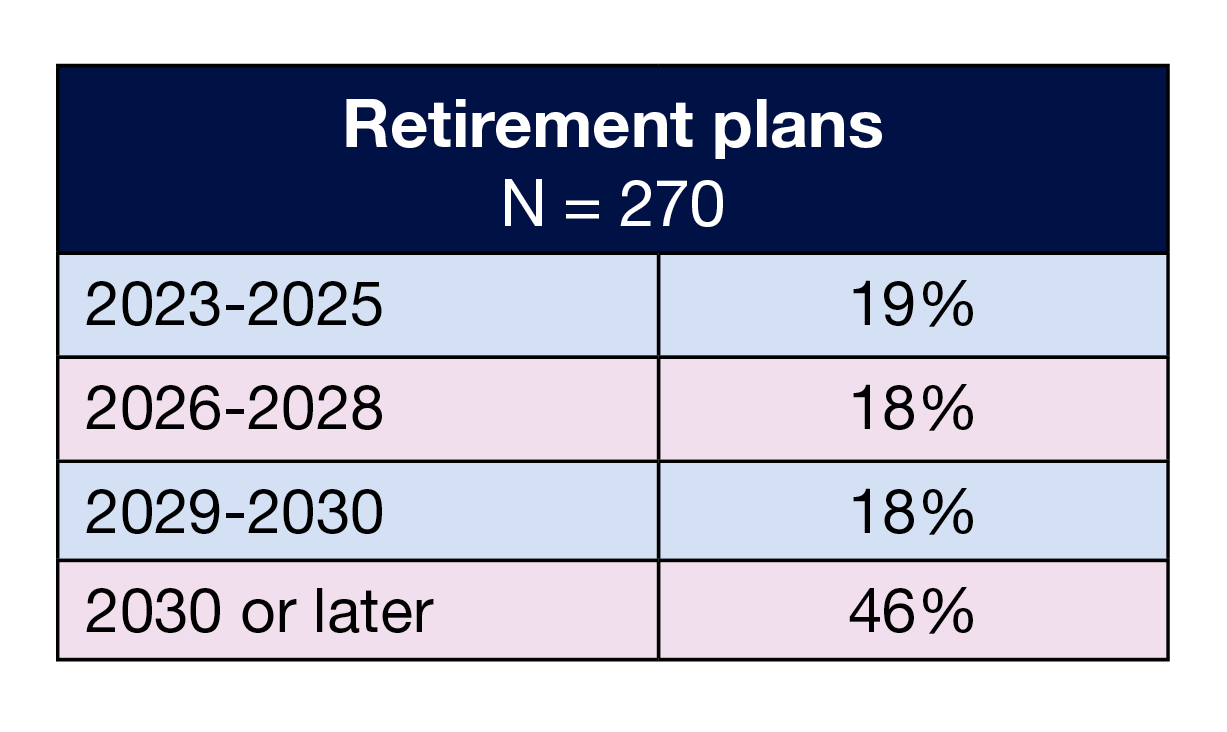
More than half (54%) of respondents have more than 10 years of experience as a perioperative manager, the same as in 2021 and higher than last year’s 44%. The number of newer managers (5 years of less of experience) has been similar over the past few years: 22% this year, 27% in 2022, and 24% in 2021, raising concerns about replacement of OR leaders who will be retiring. In fact, 19% of respondents reported they plan to retire between 2023 and 2025, with another 18% planning to exit work between 2026 and 2028.
Mayday
In all, 277 respondents answered the question, “What issue facing perioperative leaders do you feel isn’t getting enough attention?” Staffing topped the list. Aspects included not enough staff, not enough experienced staff, staff education, burnout, recruitment difficulties, and retention, especially of a generation with different expectations for work.
Sample comments related to staffing included:
- “The specialty needs to open its doors to be willing to train RN and surg techs with no experience. Training program that is standardized, measurable, and realistic.”
- “Recruiting and having an in-house program to on-board new graduates while giving them the training and education to be successful within the OR.”
- “Brain drain; long term OR staff retiring in groups of two or three at the same time. Hired together and retired together, leaving major voids in the operations of the department.”
Other issues included supply chain problems, succession planning, lateral violence, boarders in the postanesthesia care unit, and equipment factors. One respondent commented, “There is an exponential increase in equipment that can be used to augment all lines of surgery. Everyone wants something new and the ability to purchase has gone down. I have quadrupled the number of items on the wish list with very little approved for capital.”
Many respondents noted that OR leaders need attention too, especially given their high workload and increasing span of control and additional duties. Sample comments included:
- “We too are burnt out, The expectation is you work 60 hours, which makes work-life balance difficult.”
- “Burnout and physicians treating leaders poorly, especially for things that are often out of our direct control, such as staffing and having travelers who aren’t as familiar with routines as permanent staff have been.”
- “I think compensation and efforts to keep skilled leaders in the field is greatly lacking. Hours worked … continues to grow. Abusive staff and patients are also a concern.”
- “A lot of focus on staff with raises and bonuses but nothing for leaders.”
One respondent summed up this issue as, “I think we are constantly being asked to perform many roles. We need to schedule staff, attend meetings, recruit new physicians, maintain budgets, staff when needed, communicate to staff, attend community events, and the list goes on. We are expected to do this and do it well in order to maintain a great life-work balance to prevent burnout.”
This year’s survey results reflect a group of OR leaders who continue to experience many challenges while often failing to receive adequate compensation. This environment is affecting leaders’ job satisfaction and could cause them to leave the profession. Because few young nurses seem willing to take on manager roles, organizations may face a significant leadership gap just when excellent leaders are needed most.
—Cynthia Saver, MS, RN, is president of CLS Development, Columbia, Maryland, which provides editorial services to healthcare publications.
Reference
Smiley R A, Allgeyer R L, Shobo Y, et al. The 2022 national nursing workforce survey. J Nurs Reg. 2023;14(1):S1-S90.
Survey: Compensation rises slightly for ASC leaders amid on-going pressures
By Cynthia Saver

Compensation is trending slightly higher for ambulatory surgery center (ASC) leaders, according to the 2023 OR Manager Salary/Career Survey, with 68% of respondents reporting a total annual compensation of $120,000 or more, up from 50% in 2022 and 40% in 2021.
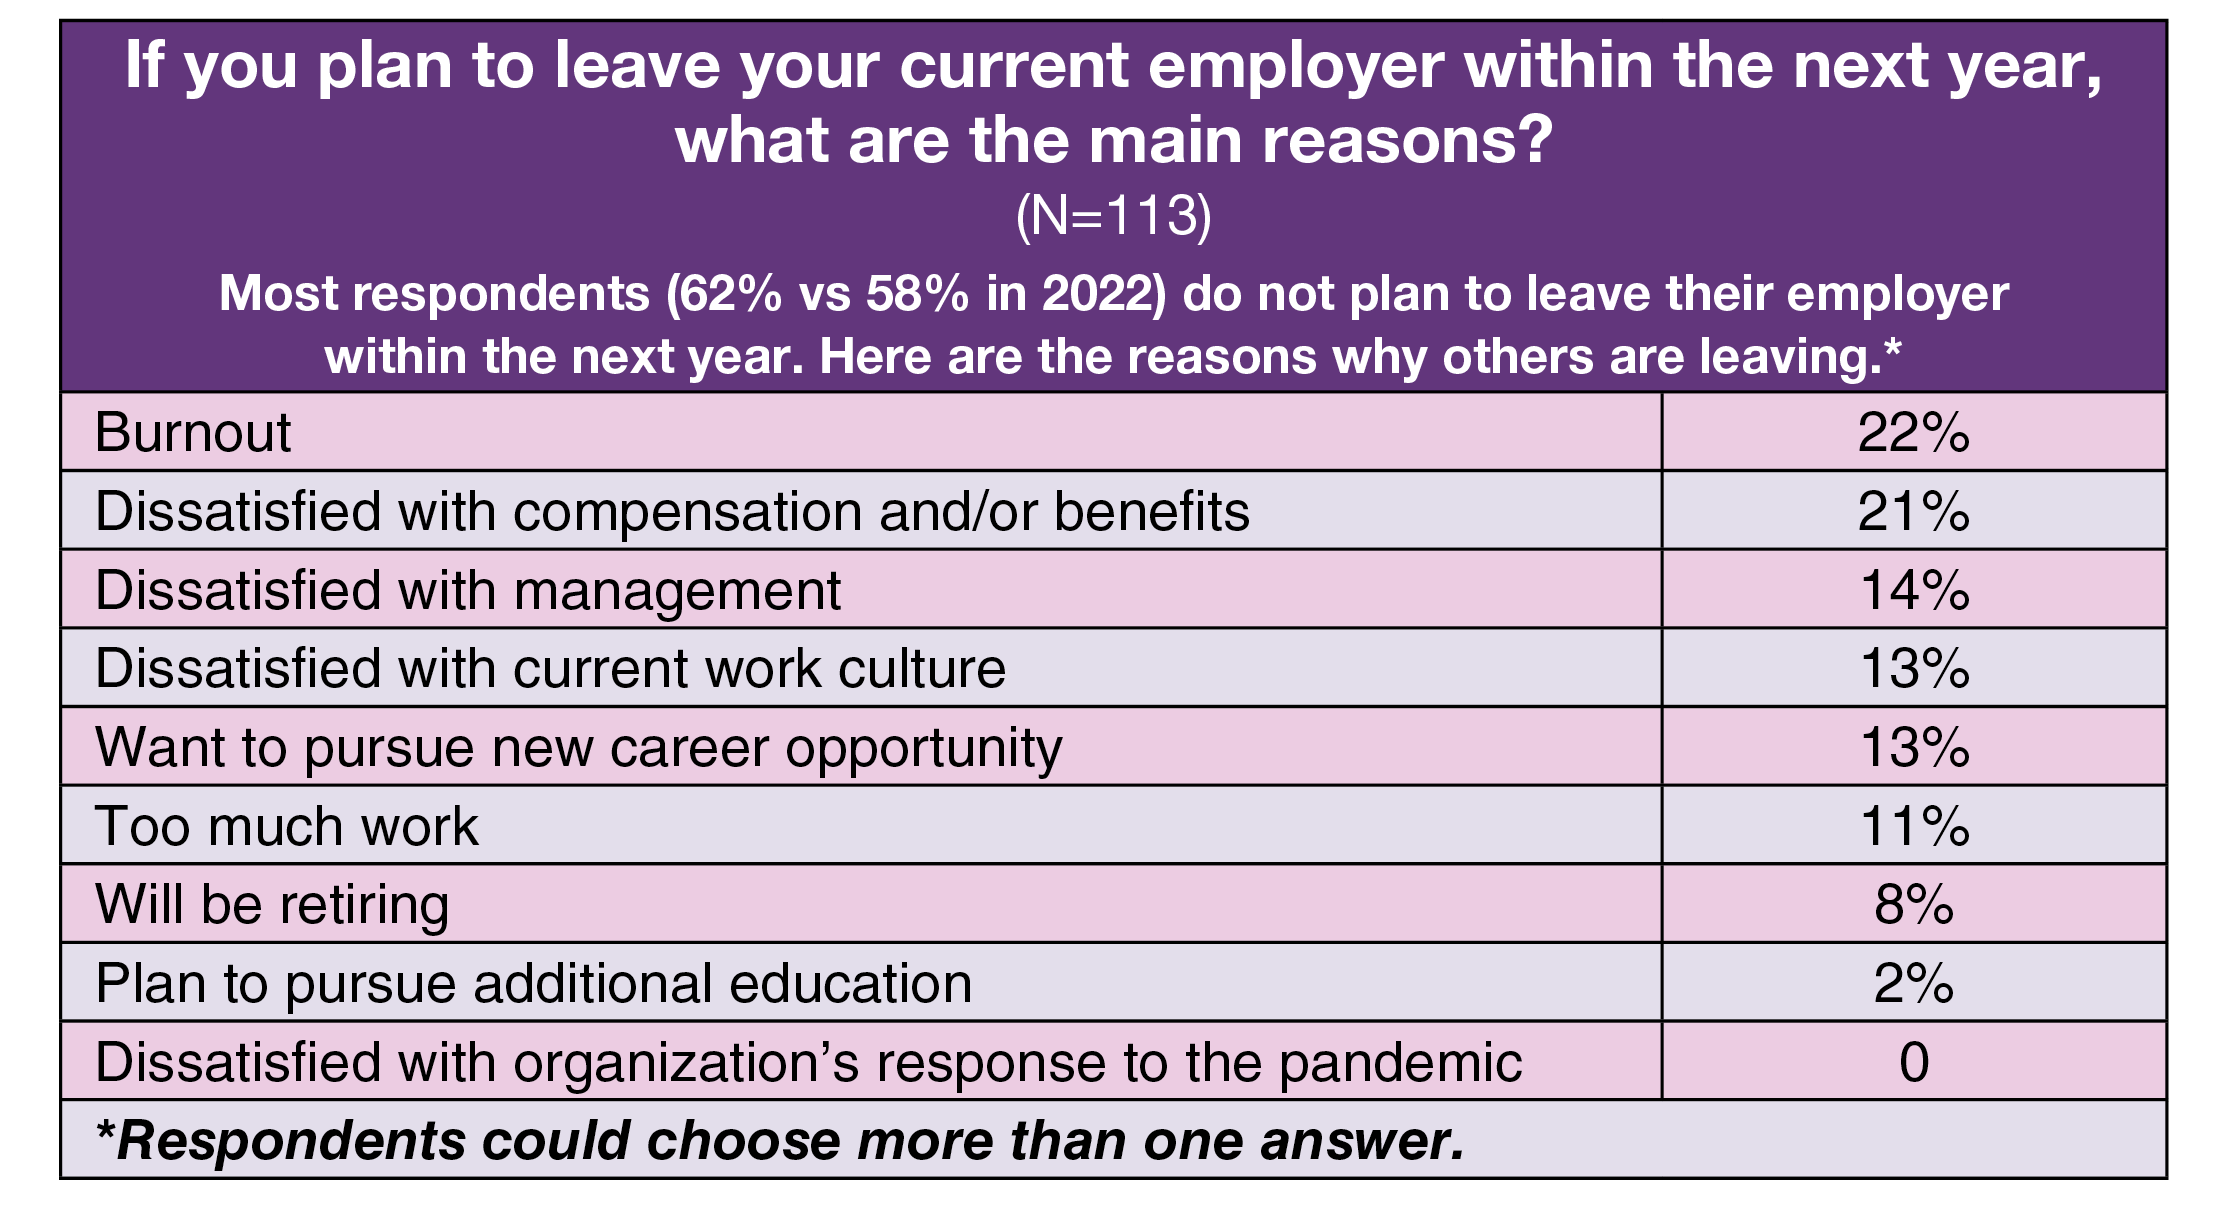
However, higher wages are unlikely to sufficiently offset the stressors ASC leaders are experiencing. For example, those who responded they are planning to leave their current employer within the next year most commonly cite burnout (22%) as the reason, which is comparable to the 25% who cited this factor in 2022.
In addition, ASC leaders are seeing their responsibilities continue to grow. For example, they now supervise an average of 40 employees, compared to 36 in 2022 and up from 32 in 2019, the last survey before the COVID-19 pandemic. Despite the challenges of the current environment, satisfaction levels are generally on par with prepandemic levels. For instance, 73% view their current job or position favorably, compared to 74% in 2019.
Other highlights from the survey include:
- More respondents received a raise in the past 12 months compared to 2022 (74% vs 66%). The average raise was 5.1% (4.8% when the single 30% response is omitted), higher than last year’s 4.24%, but still lower than the 2022 consumer price index of 6.5%.
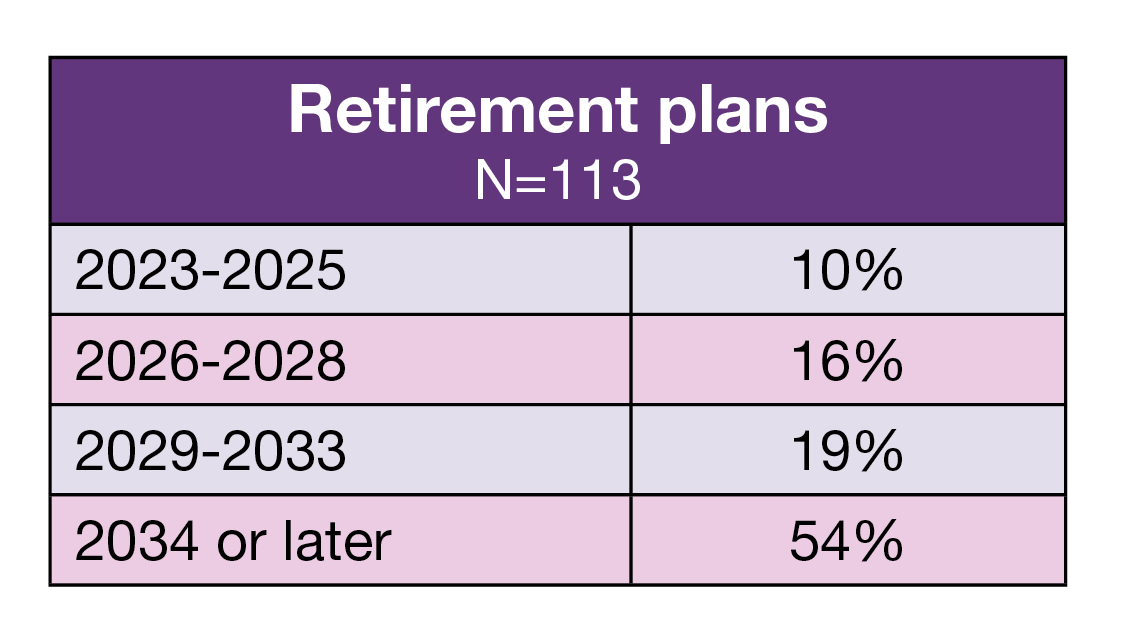
- More than half (54%) of respondents plan to retire in 2024 or later, with 10% planning to head for the work exit by the end of 2025.
- Half of respondents plan to stay with their current employer 5 years or more (vs 55% in 2022), but 28% (vs 24% in 2022) plan to stay 2 years or less; 22% plan on staying 3 to 5 years.
This article takes a closer look at findings related to ASC leaders. (Percentages may not add up to 100% due to rounding.)
Financial details
The survey included questions about salary and total compensation.
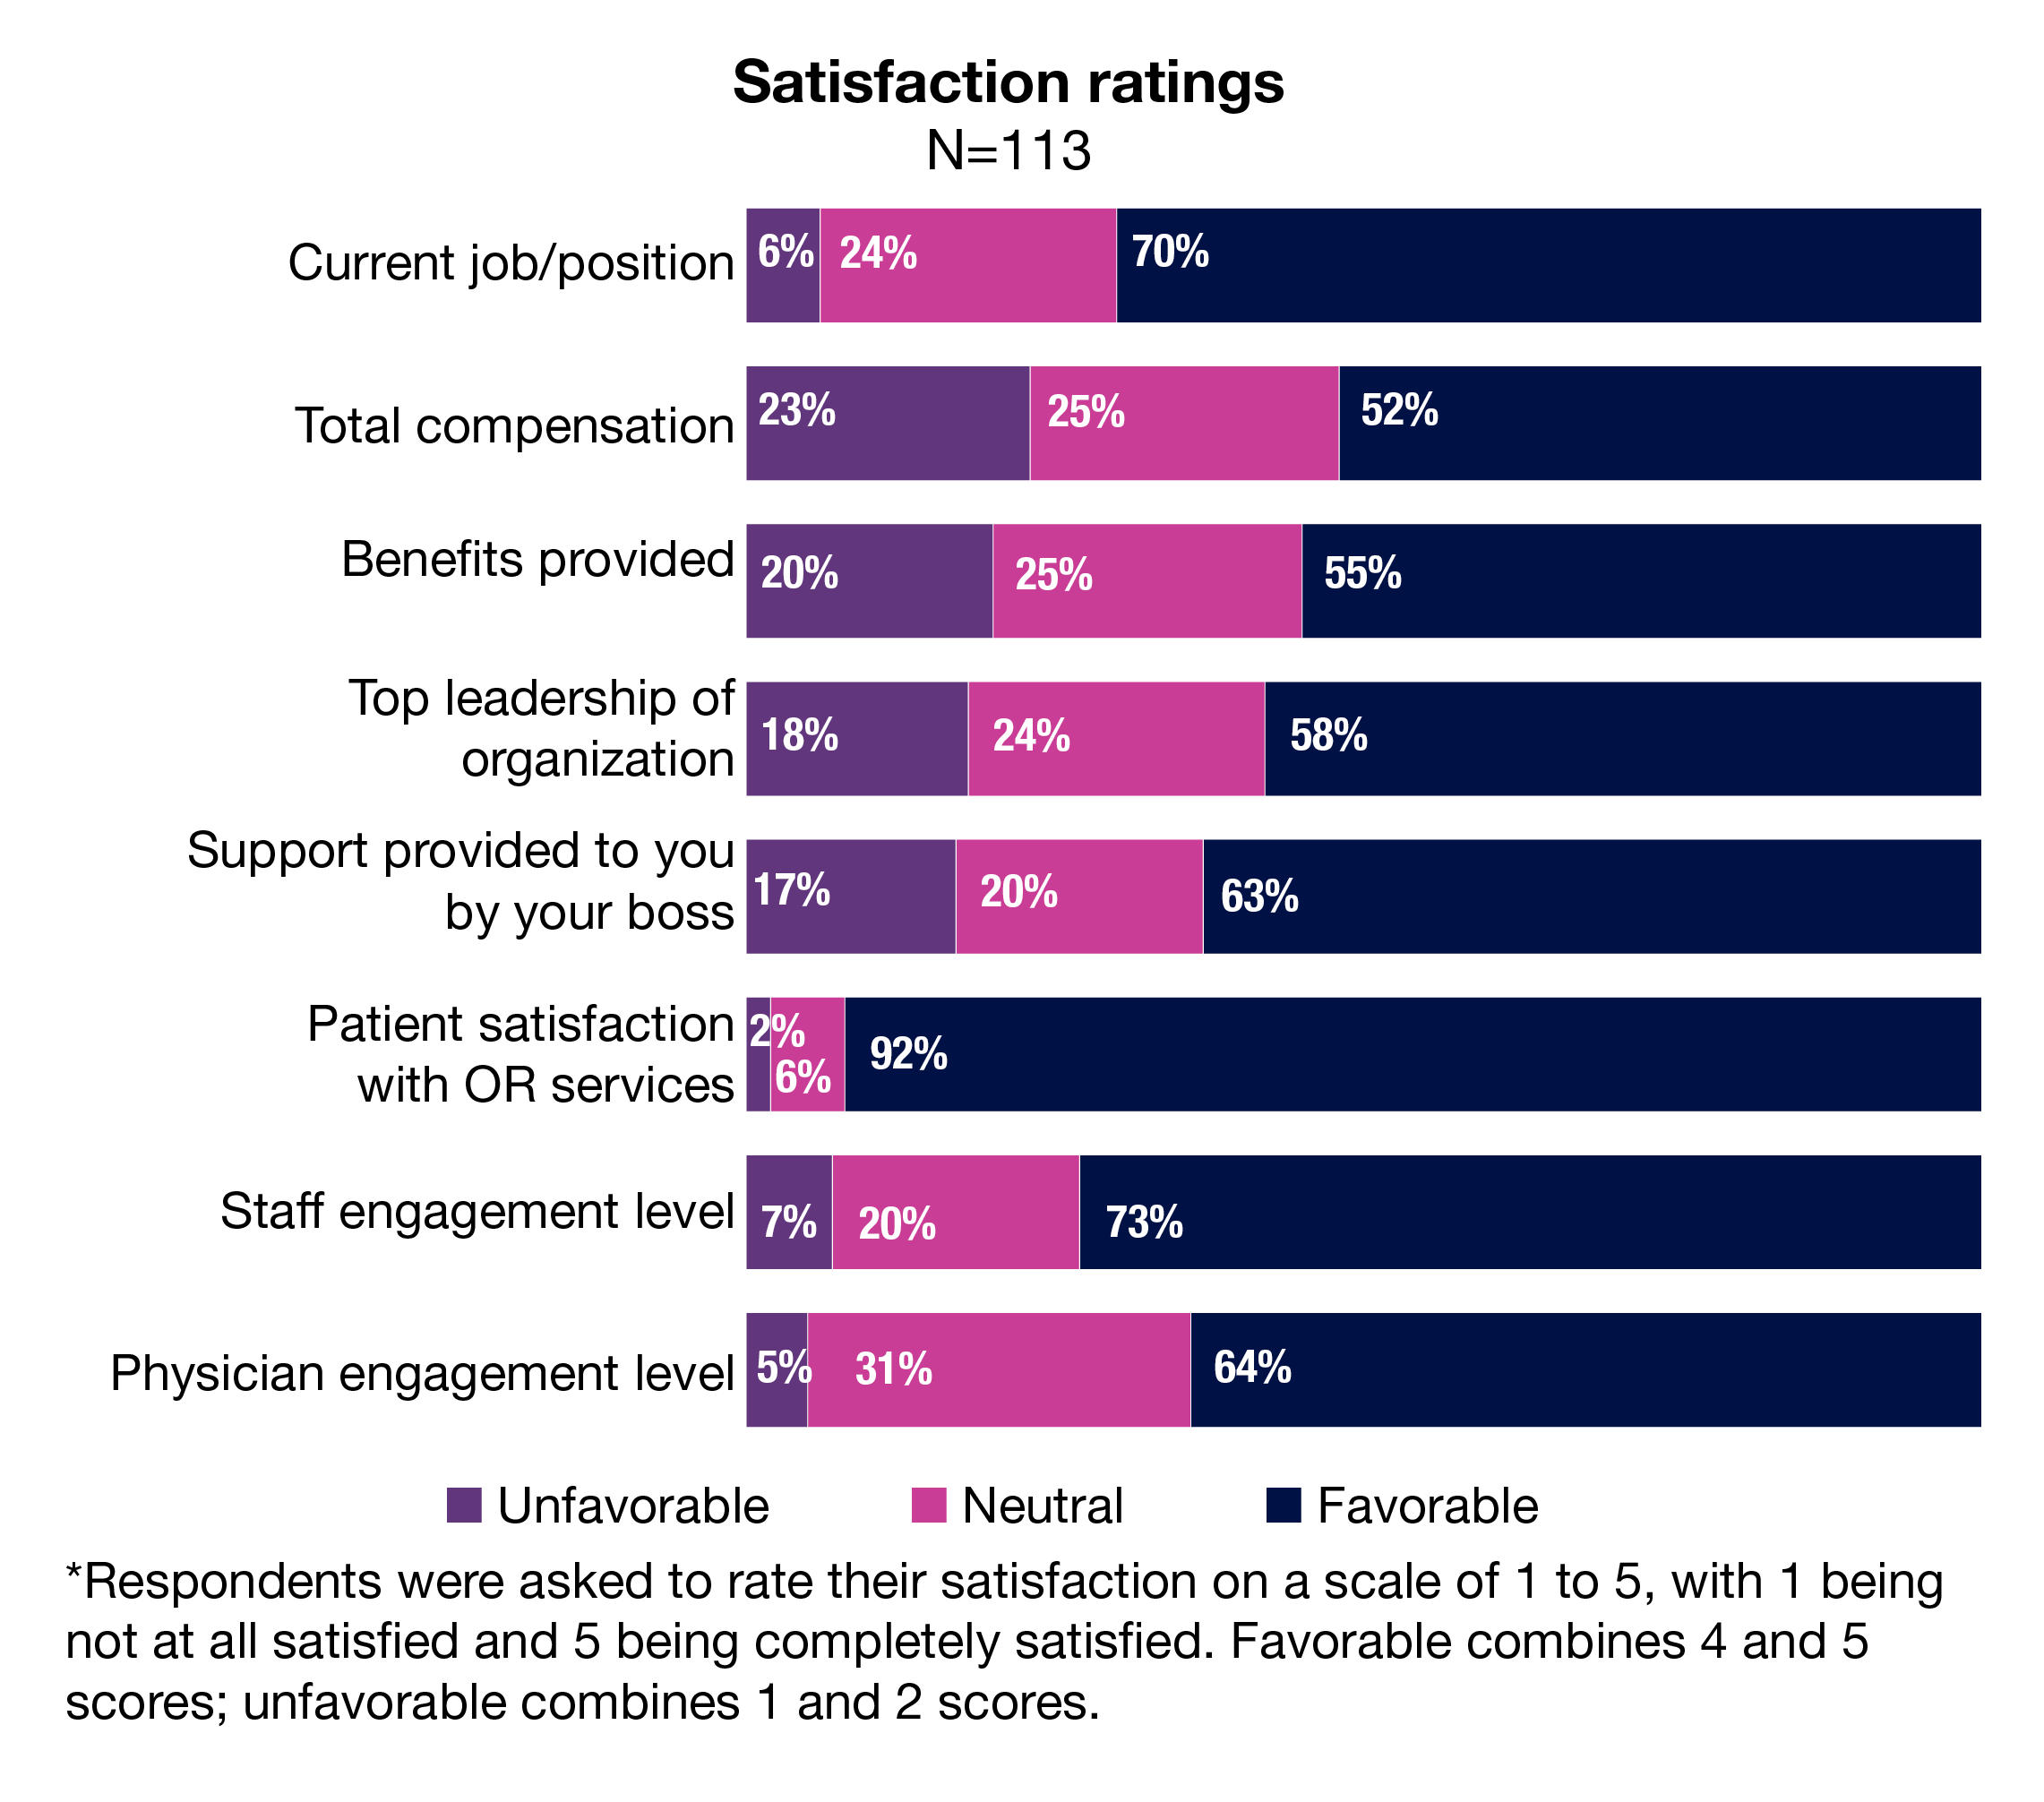
Salary. More than three-quarters (77%) of respondents reported earning an average annual salary of $100,000 or more, up from 58% in 2022 and 51% in 2021. The most common salary ranges were $100,000 to $119,999 (32% vs 23% in 2022) and $120,000 to $149,999 (28% vs 22% in 2022). The percentage of those earning $150,000 or more was 17%, nearly three times higher than the 2021’s 6%.
As expected, salary range varied by job title. The few (2%) respondents who have vice president or chief nurse executive as their title earn $150,000 or more. Most directors and assistant directors earn between $100,000 and $119,999 (34%), followed by $120,000 to $149,999 (25%). Those ranges are the same for administrators and administrative directors, with percentages of 39% and 34%, respectively. Most nurse managers chose either the $120,000 to $149,999 (26%) or $100,000 to $119,999 range (24%).
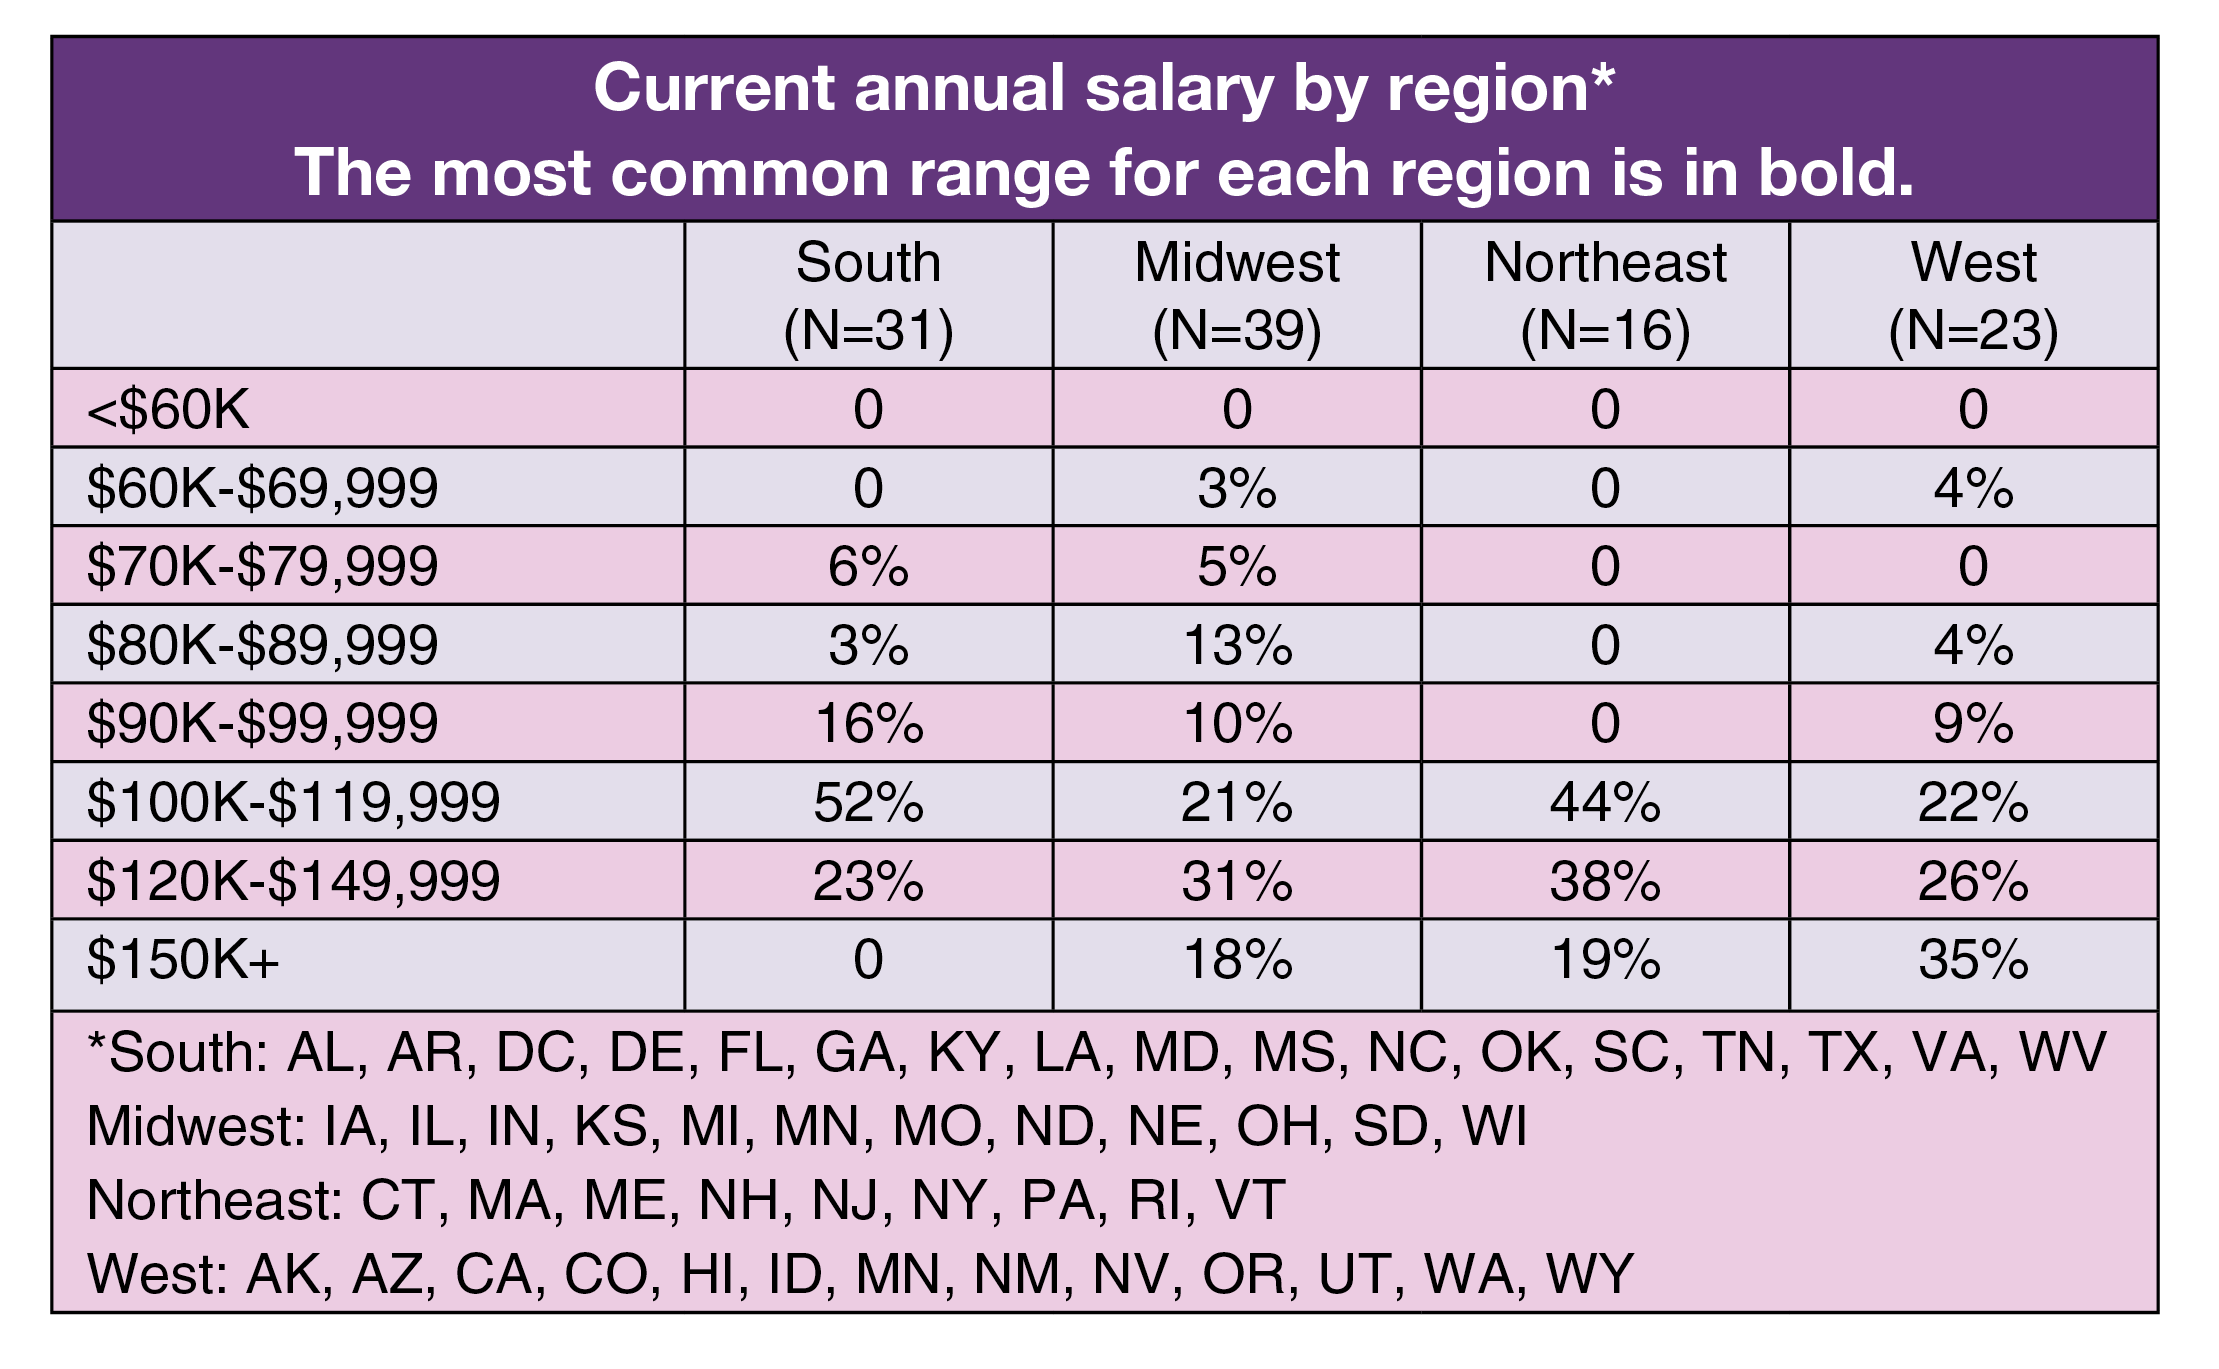
Salary also varied by region. Most ASC leaders in the West (35%) reported earning a salary of $150,000 or more, and most leaders in the Midwest (31%) earn $120,000 to $149,999. The most common range for respondents in the South and Northeast was $100,000 to $119,999 (52% and 44%, respectively).
The most common salary ranges were the same for leaders in multispecialty and single specialty ASCs. Nearly a third (31%) of multispecialty respondents earn between $100,000 and $119,999, similar to the 33% reported by single specialty respondents, and 28% of both groups reported earning between $120,000 to $149,999.
When broken down by services offered, the top two salary ranges for leaders in both single and multispecialty ASCs were $100,000 to $119,999 (33% for single specialty and 31% for multispecialty) and 120,000 to $149,999 (28% for each group).
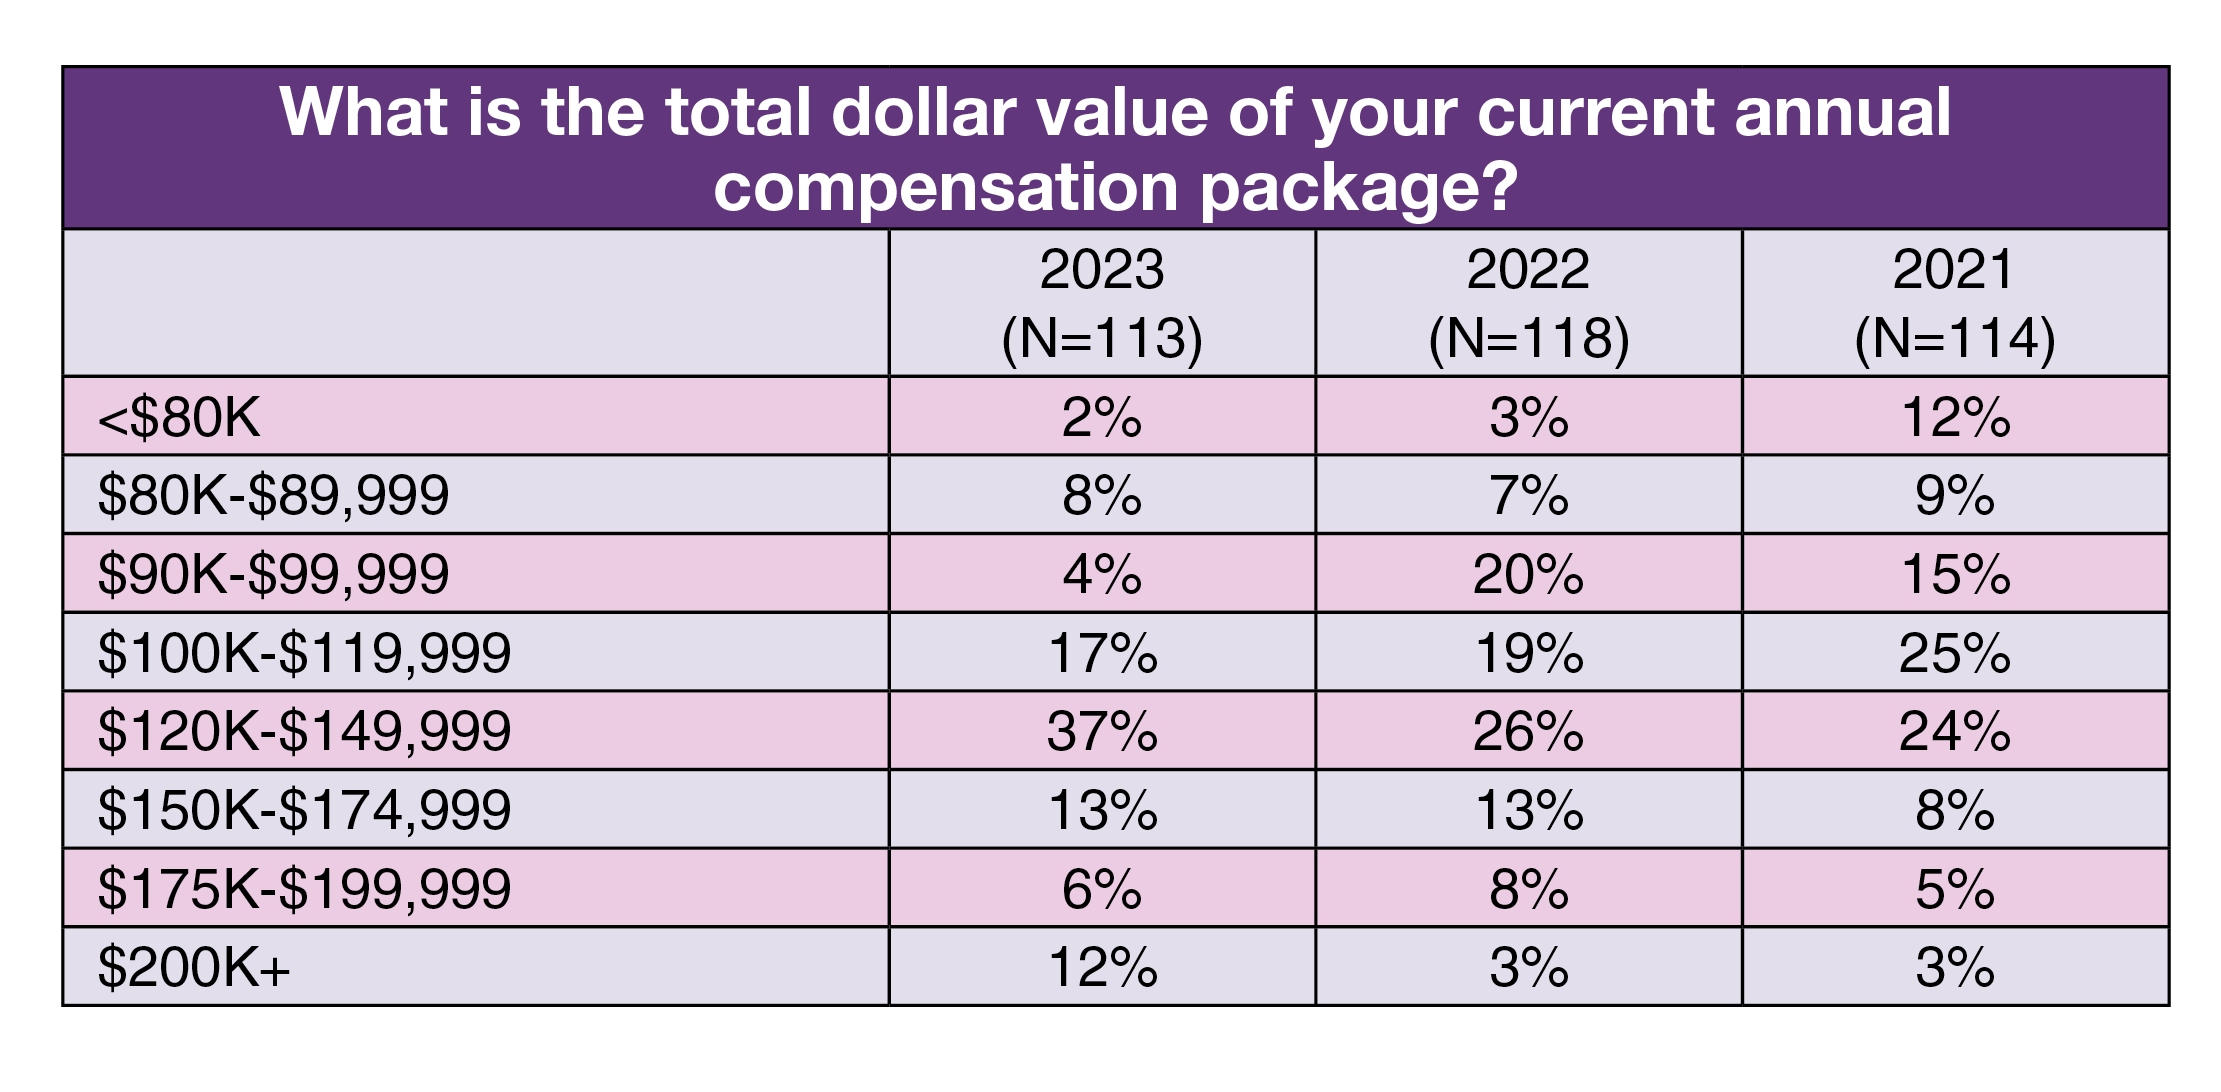
Total compensation. Most respondents (37%, the same as 2022) reported they fell into the total compensation range of $120,000 to $149,999. Only 14% earn less than $100,000.
As with salary, the most common total compensation range varied by title. Vice president or chief nurse executive respondents earn $200,000 or more annually in total compensation. The most common range for other job titles was $120,000 to $149,999: 42% for nurse managers, 39% for administrators or administrative directors, and 31% for directors or assistant directors.
Respondents in all four regions most commonly reported a total compensation range of $120,000 to $149,999: 56% for the Northeast, 45% for the South, 35% for the West, and 28% for the Midwest.
Leaders in multispecialty ASCs generally earn more in total compensation than those in single specialty centers. Half of leaders in single specialty centers earn $120,000 or more, compared to 82% of those in multispecialty centers. Both groups most commonly chose the range of $120,000 to $149,999 (30% of single specialty leaders and 42% of multispecialty leaders).

Span of control
ASC leaders’ increasing level of responsibility is reflected in the number of people they oversee. As noted earlier, respondents supervise an average of 40 full-time equivalent (FTE) positions, up from 32 in 2019, the year before the COVID-19 pandemic. This year, the average was 32 for clinical and 8 for nonclinical positions.
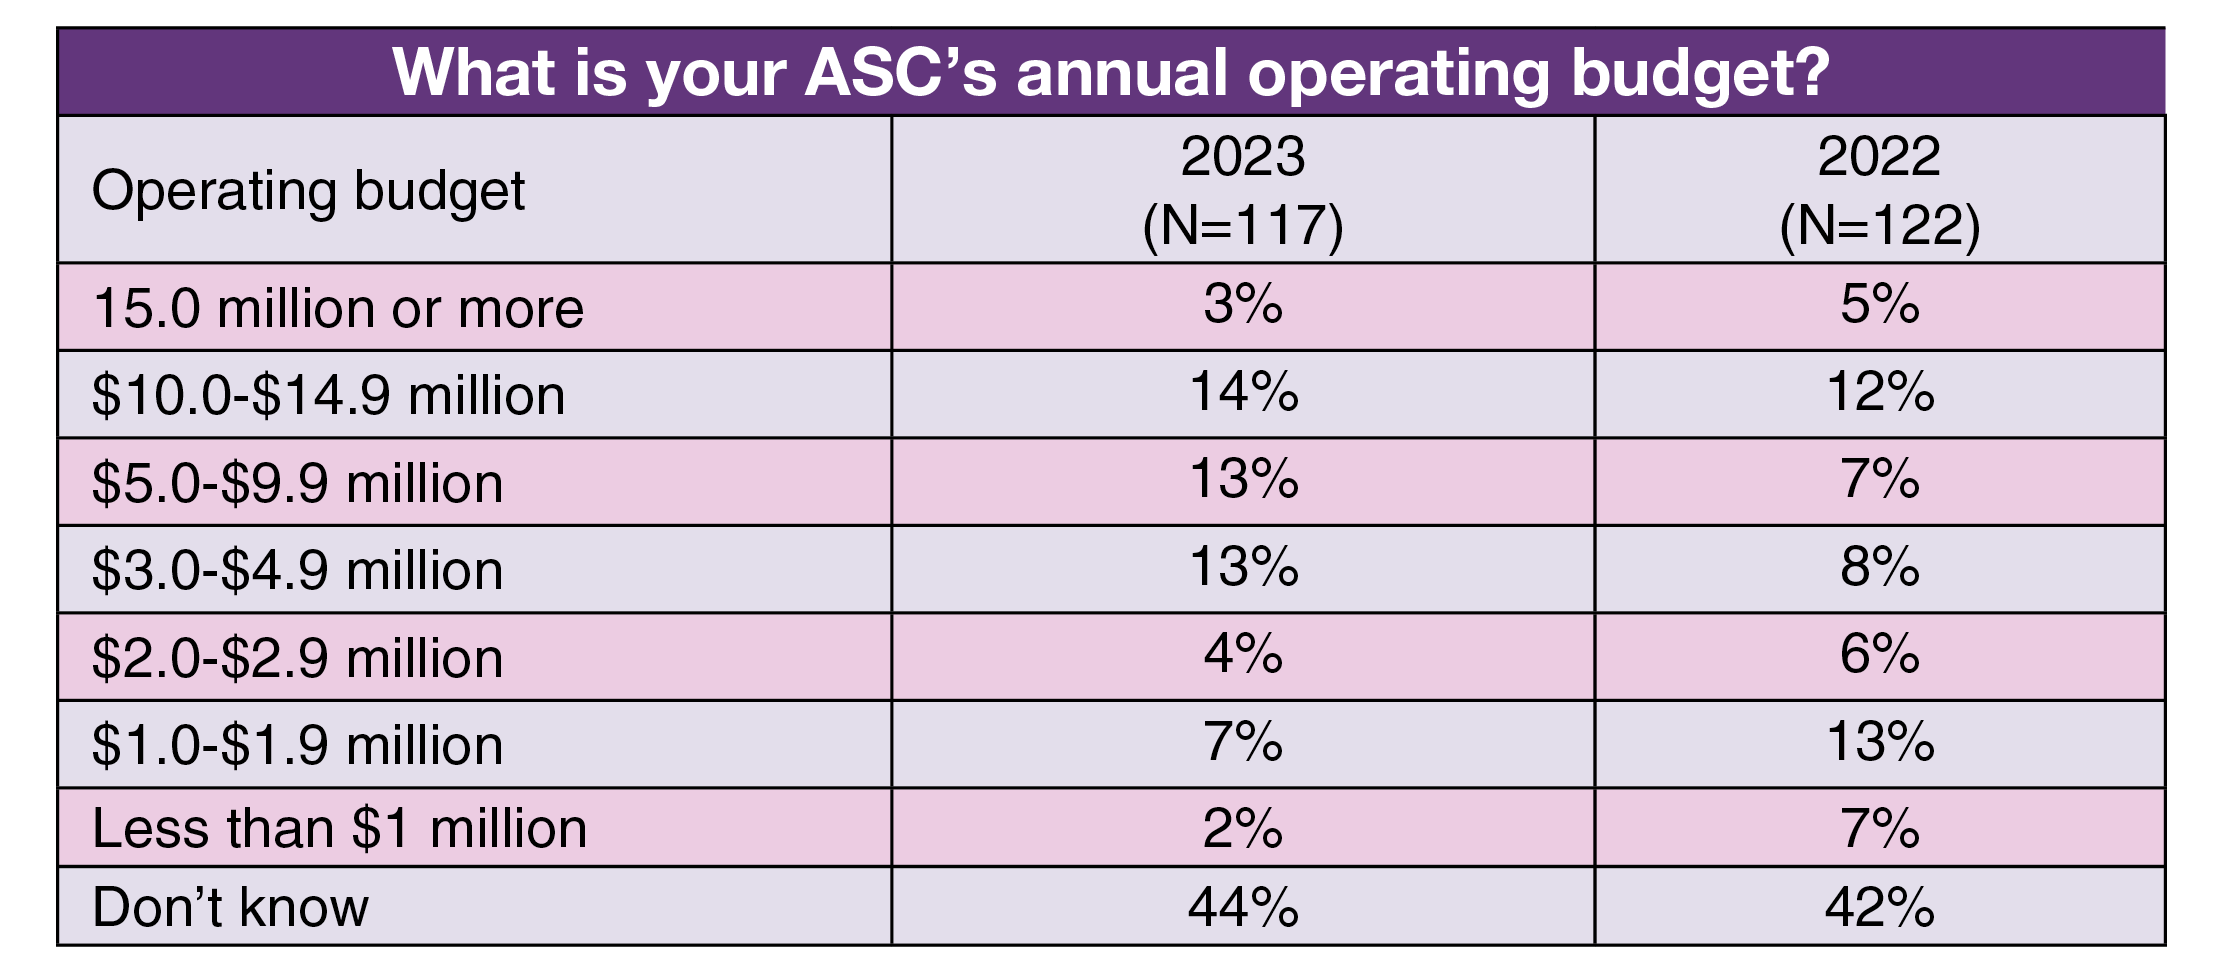
Many ASC leaders (44%) reported they did not know the amount of their operating budget. Of those who did know, most (14%) are responsible for an operating budget of $10 million to $14.9 million, closely followed by $5 million to $9.9 million and $3 million to $4.9 million (13% for each). As a comparison, in 2022, the most common range was $1 million to $1.9 million (13%), followed by $10 million to $14.9 million (12%).
Similar to 2022, nearly half (48% vs 47% last year) of respondents reported that their operating budget had increased in the past 12 months. Only 12% reported a decrease.
OR leaders who responded were asked how many ORs they managed, and they could choose from one to 10 or more. Most choose four ORs (26%), followed by two (23%). Overall, 79% of respondents oversee one to five ORs, which is comparable to last year’s 80%. Only 6% are responsible for 10 or more ORs.
Satisfaction outlook
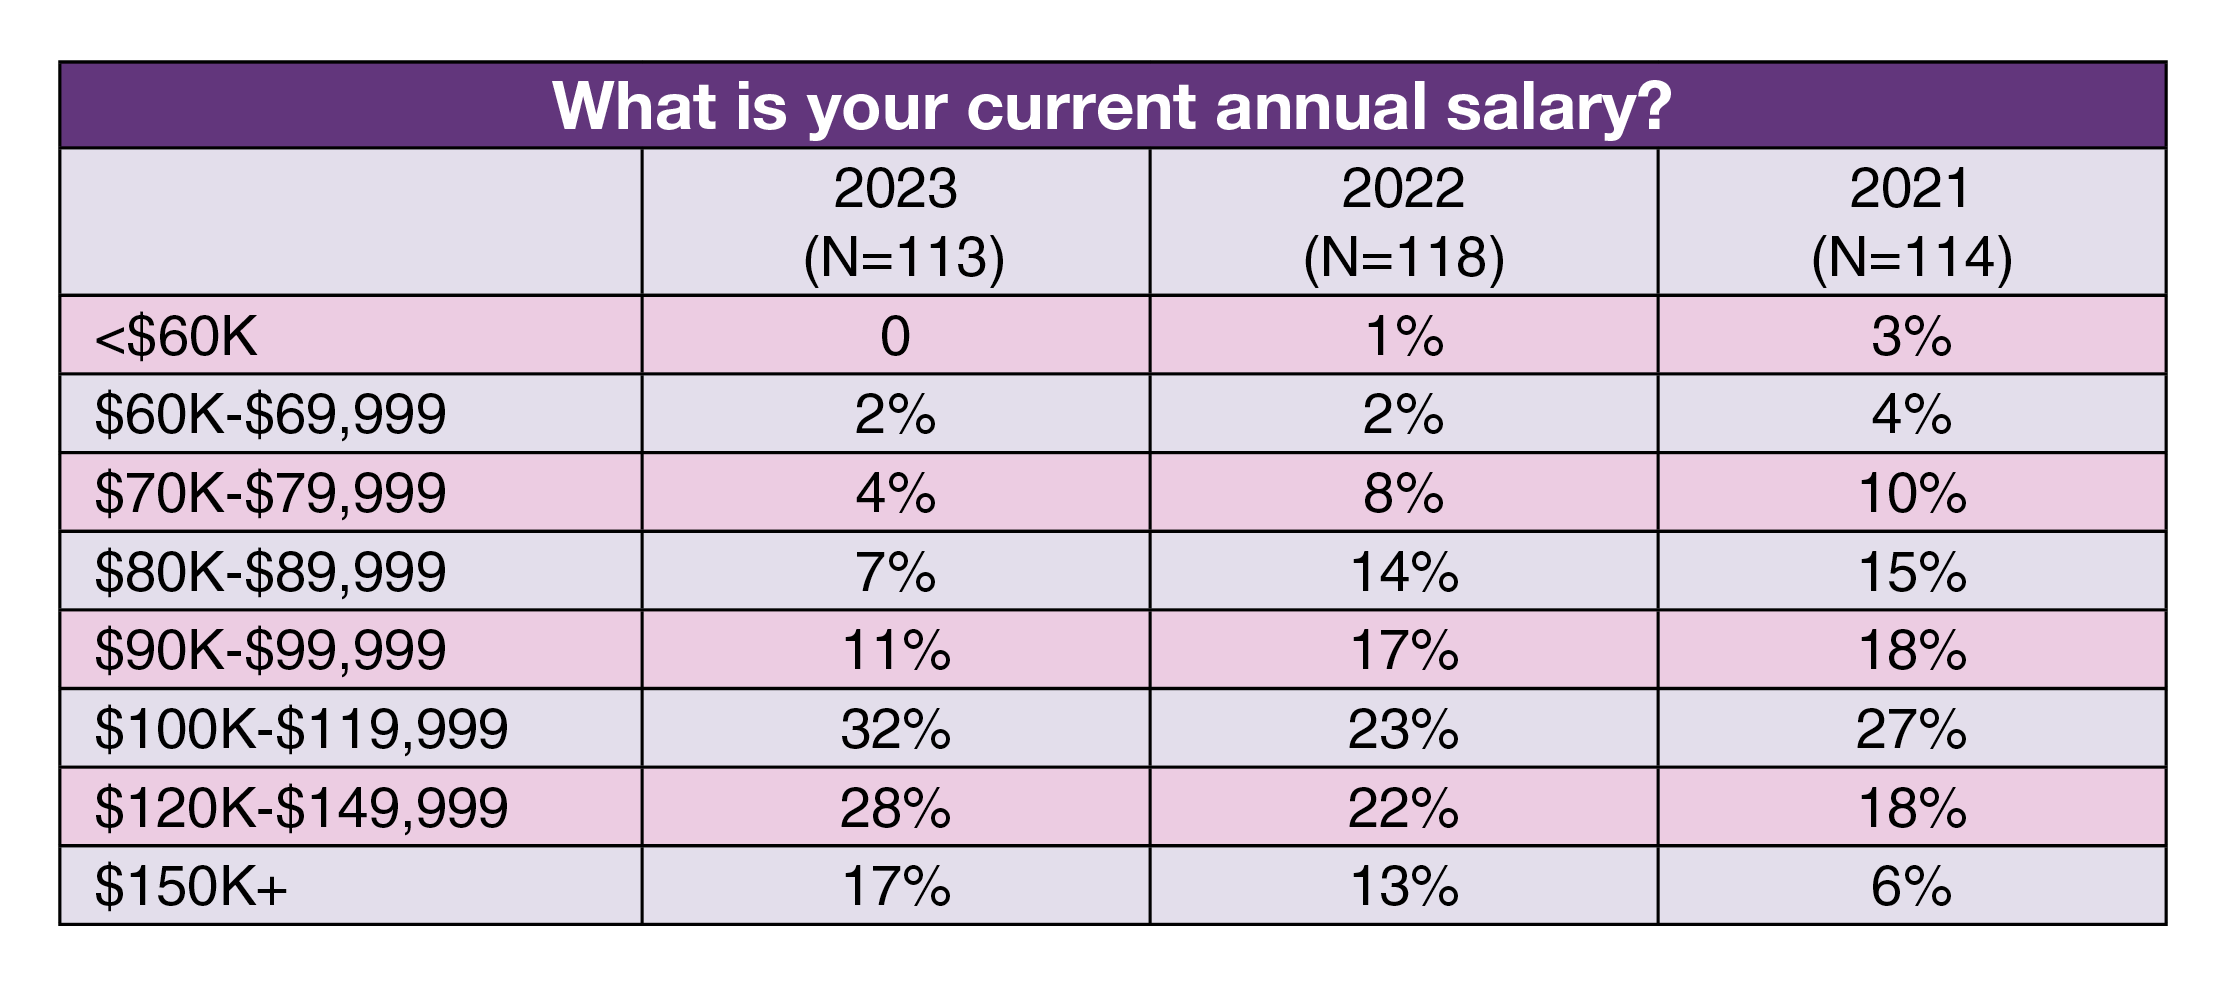
Changes in satisfaction compared to 2022 mostly trended slightly downward. Drops in satisfaction were seen in total compensation (52% vs 55%), top leadership of the organization (58% vs 62%), support provided by the respondent’s boss (63% vs 70%), and physician engagement level (64% vs 71%).
On the other hand, satisfaction with staff engagement rose from 69% to 73%. As in previous years, respondents were most pleased with patient satisfaction with OR services (92% vs 88% in 2022).
Comparing these results to prepandemic (2019) satisfaction levels reveal some interesting patterns. For the most part, levels are relatively similar. For instance, job satisfaction was 74% in 2019, compared to 70% this year, and satisfaction with support provided by respondent’s boss was 62%, comparable to this year’s 63%. However, satisfaction with the organization’s top leadership was 63% in 2019, several percentage points higher than this year’s 58%. Patient satisfaction with OR services has risen from 72% in 2019 to 92% this year.
Nearly two-thirds (62% vs 58% in 2022) do not plan to leave their employer within the next year. Burnout and dissatisfaction with compensation and/or benefits topped the list of reasons for those who were planning to leave (22% and 21%, respectively; respondents could choose more than one option). Other common reasons were dissatisfaction with management (14%) or with the current work culture (13%).
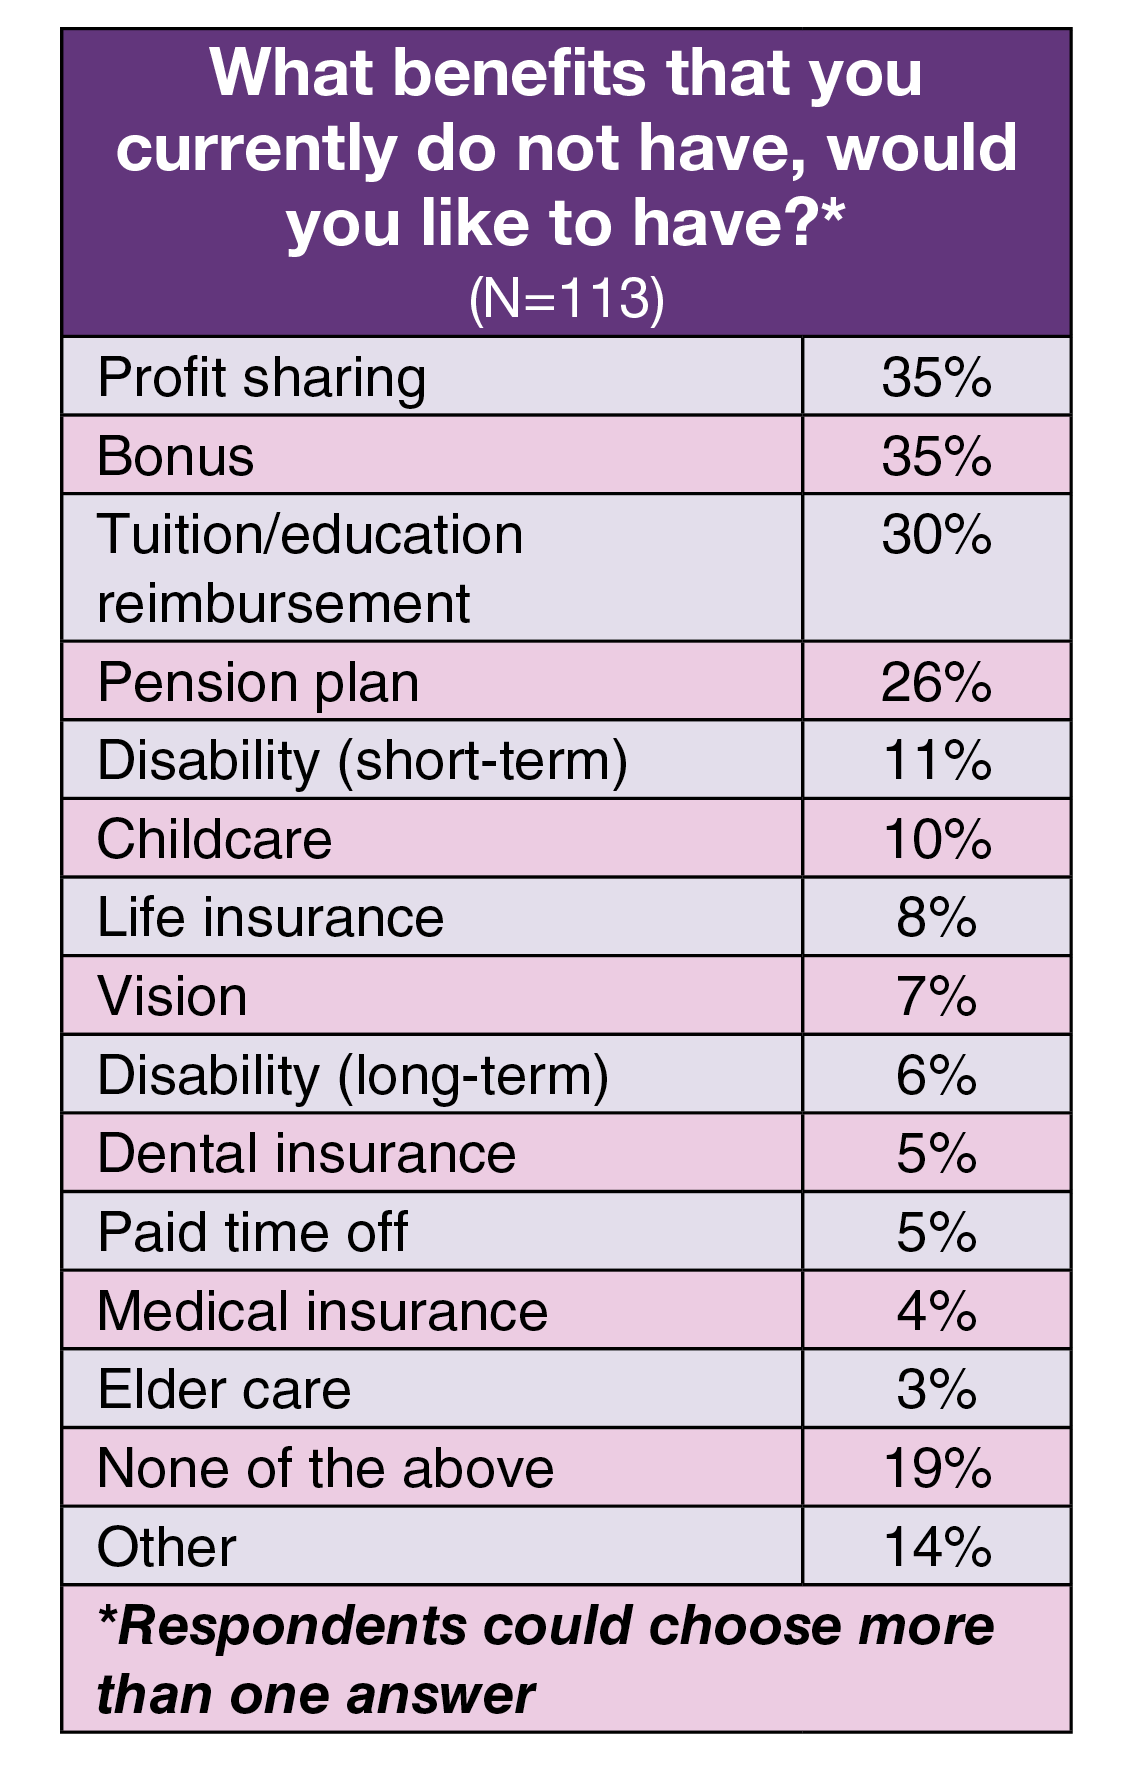
Benefits can be a powerful retention tool, so we asked respondents to select from a list the benefits they would like to receive if they did not currently have them. Consistent with past years’ surveys, money-related benefits topped the list: profit sharing (35%), bonus (35%), tuition/education reimbursement (30%), and pension plan (26%). These are the same as the top four in 2022. Sixteen respondents provided other suggested benefits, including flexibility in work schedule, 4-day work week, remote workdays for administrative work, and health insurance for dependents.
About ASC leaders
Overall demographics are listed in the infographic (p X). The average age of respondents was 51 years (vs 48 in 2022 and 51 in 2021). The average age of an RN is 52 according to The 2020 National Nursing Workforce Survey.
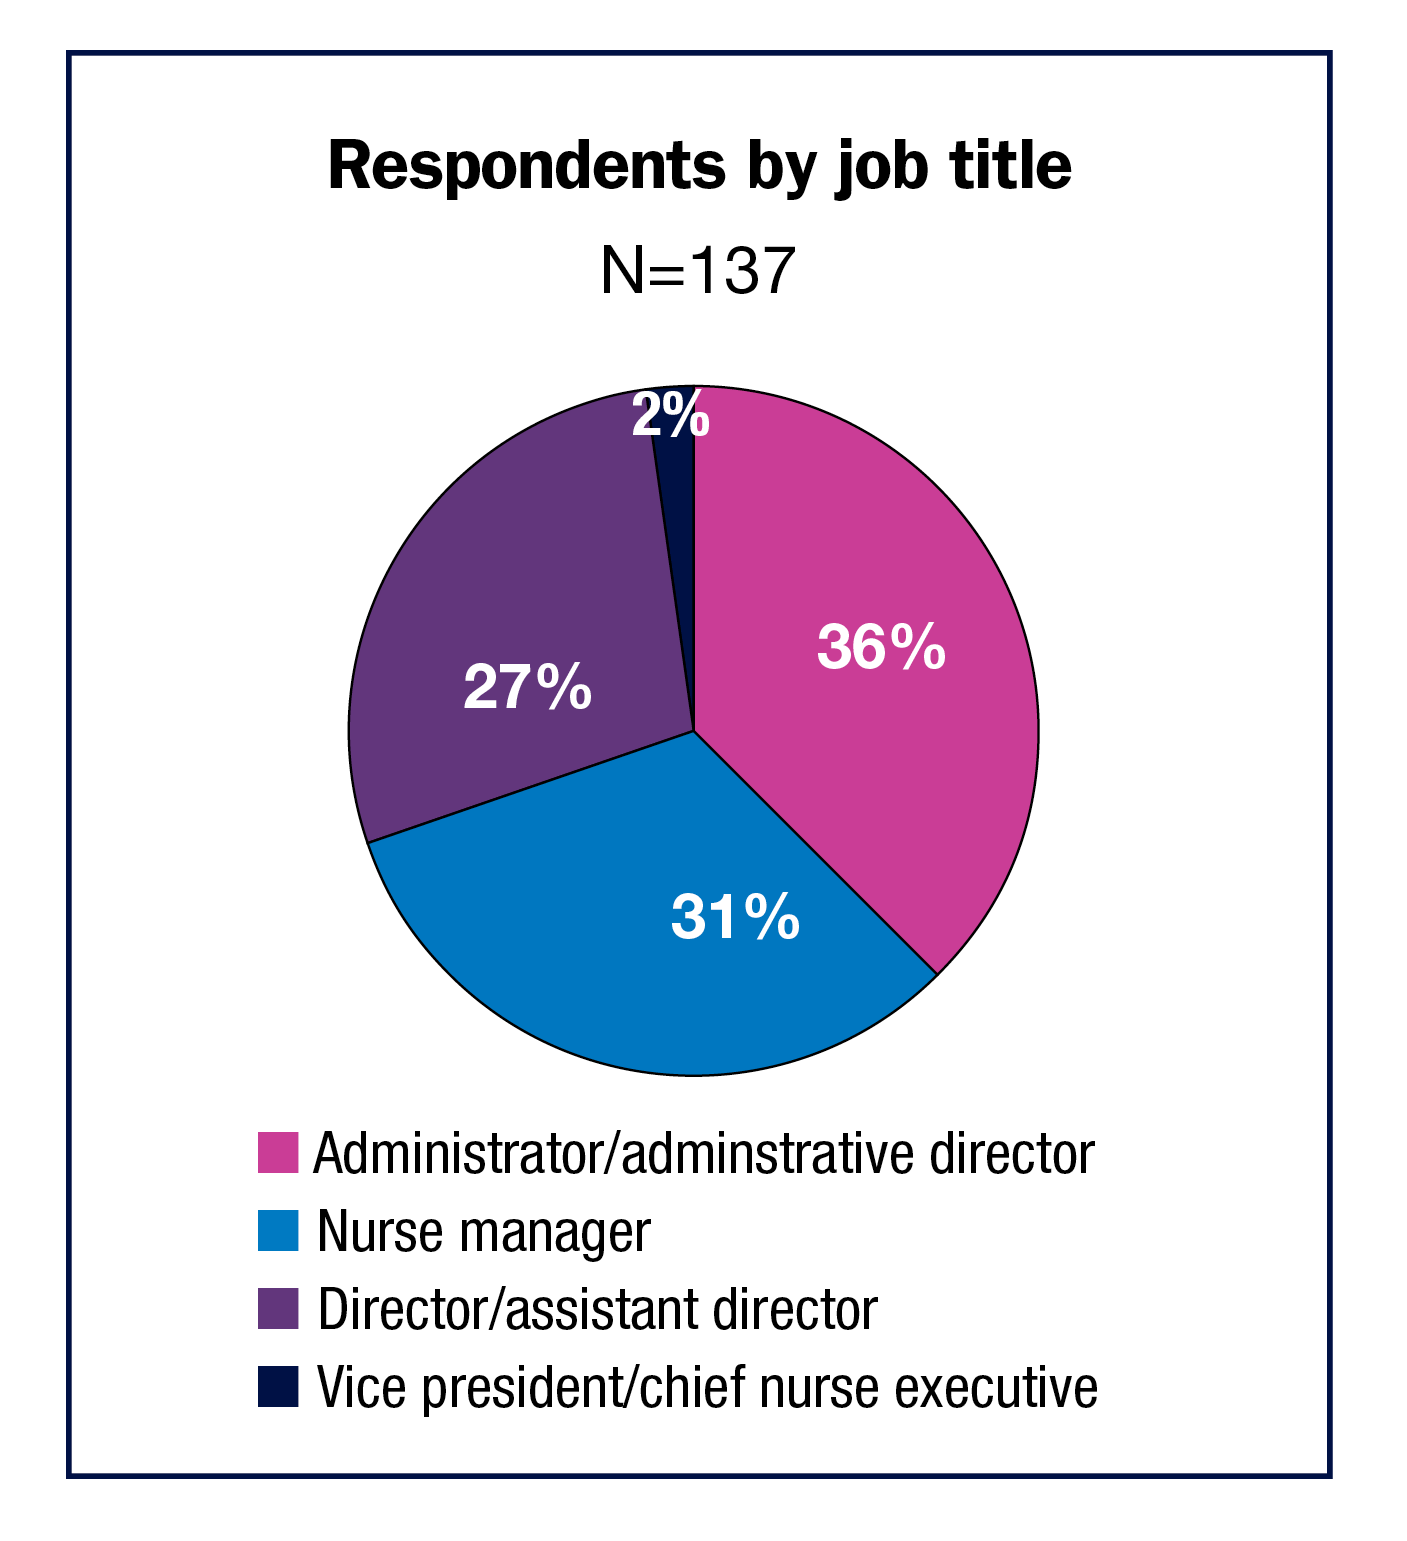
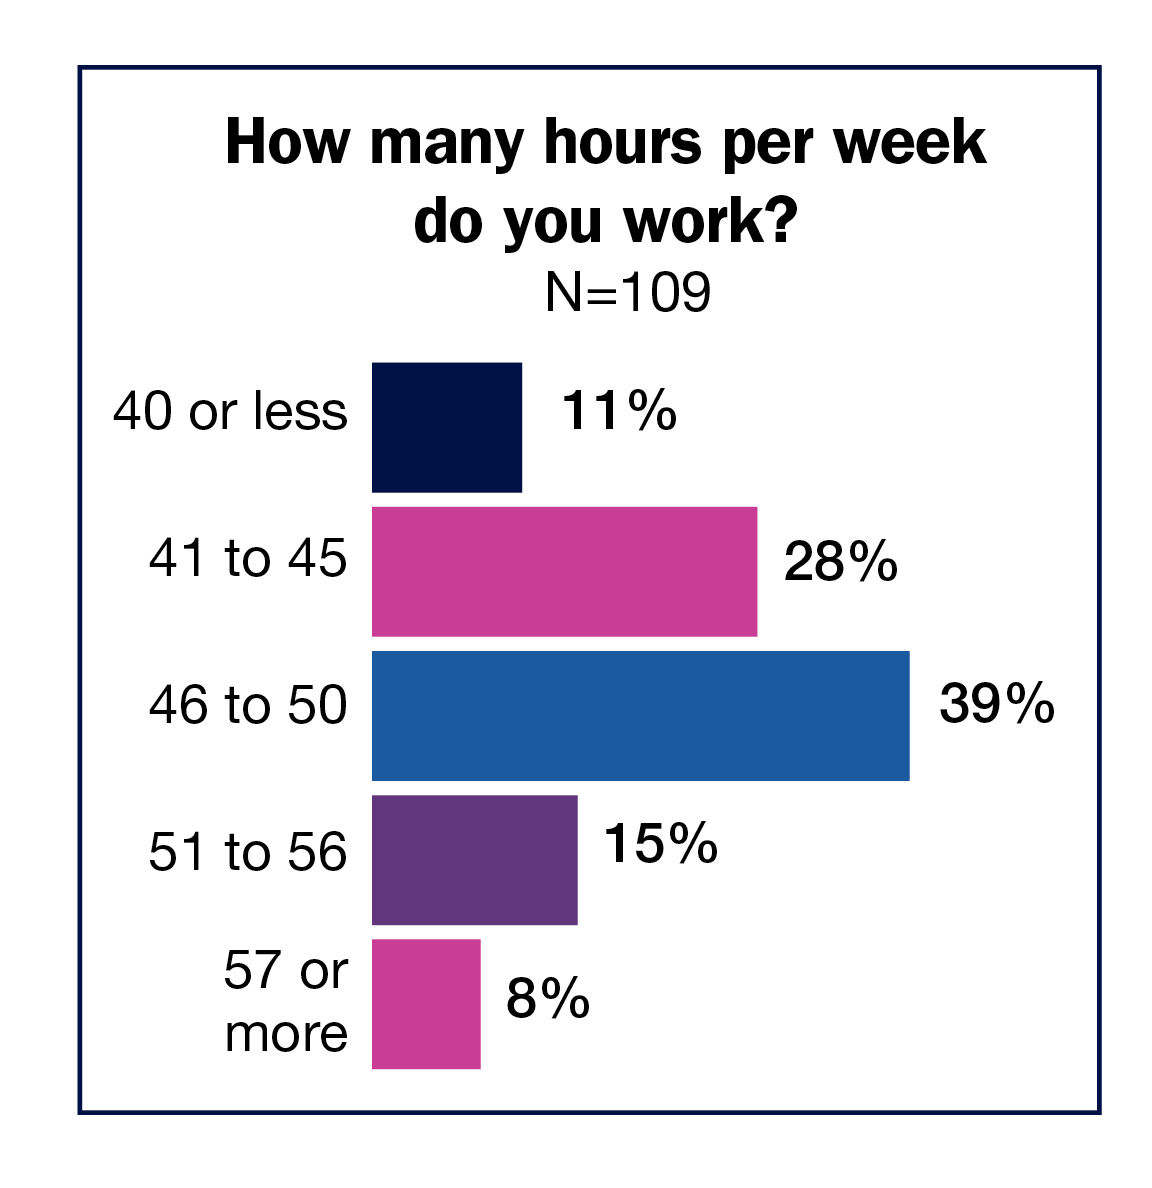
Most respondents (36%) chose administrator/administrative director as their title, and 31% chose nurse manager. These were followed by 27% for director/assistant director and 2% for vice president/chief nurse executive. No matter their title, ASC leaders are working hard. Most (39%) spend 46 to 50 hours a week at work, with another 28% reporting 41 to 45 hours; 8% spend 57 hours or more.
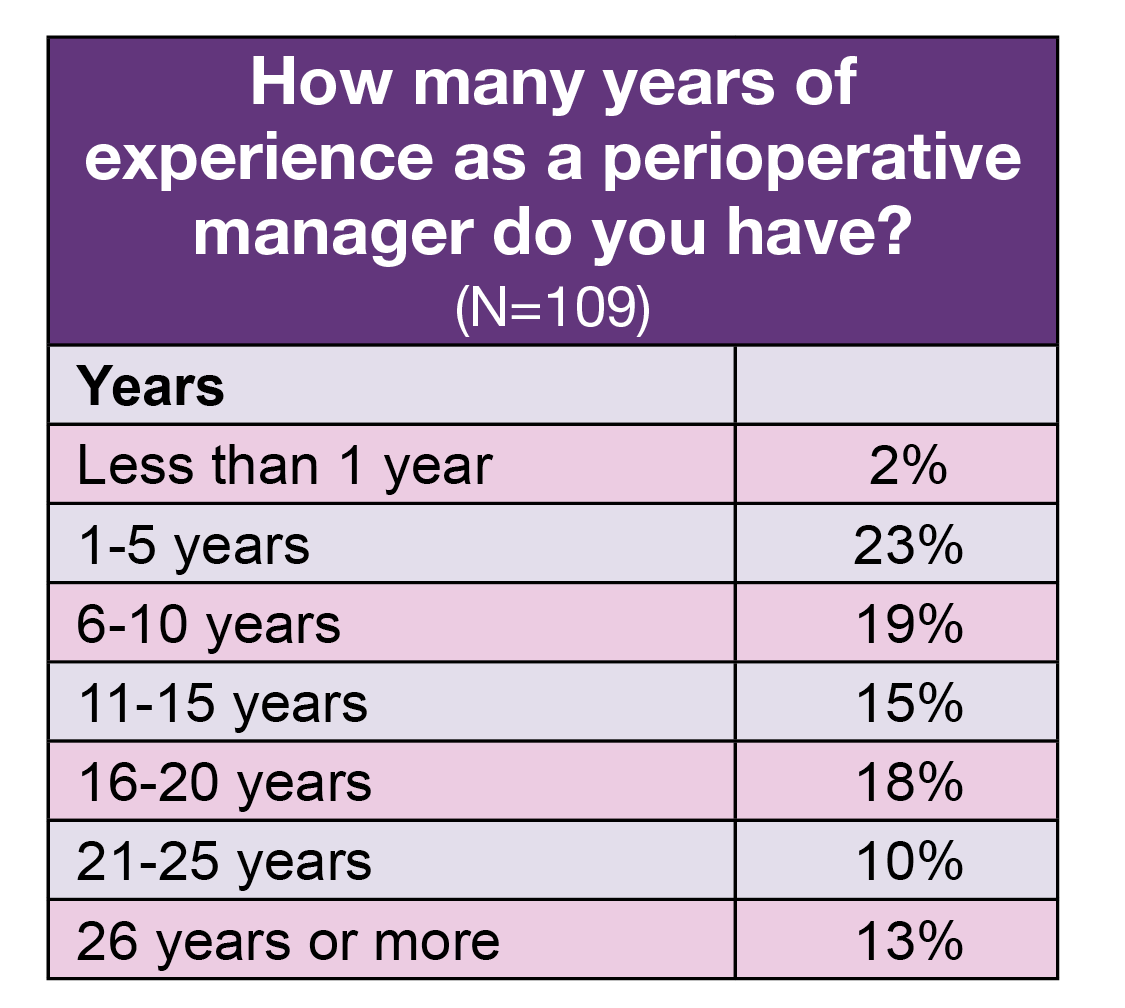
One fourth of respondents have 5 years or less of experience as a perioperative manager, compared to 29% in 2022. The results highlight the importance of succession planning, with 41% of respondents reporting 16 years or more of perioperative management experience. In addition, 26% plan to retire by 2028, a mere 5 years away.
Diversity remains limited among ASC leaders, with most respondents (86%) choosing White as their race or ethnicity. The next highest response was Asian (4%), followed by African American/Black (3%), and Hispanic/Latinx (1%). None chose American Indian/Alaska Native or Native Hawaiian/Other Pacific Islander.
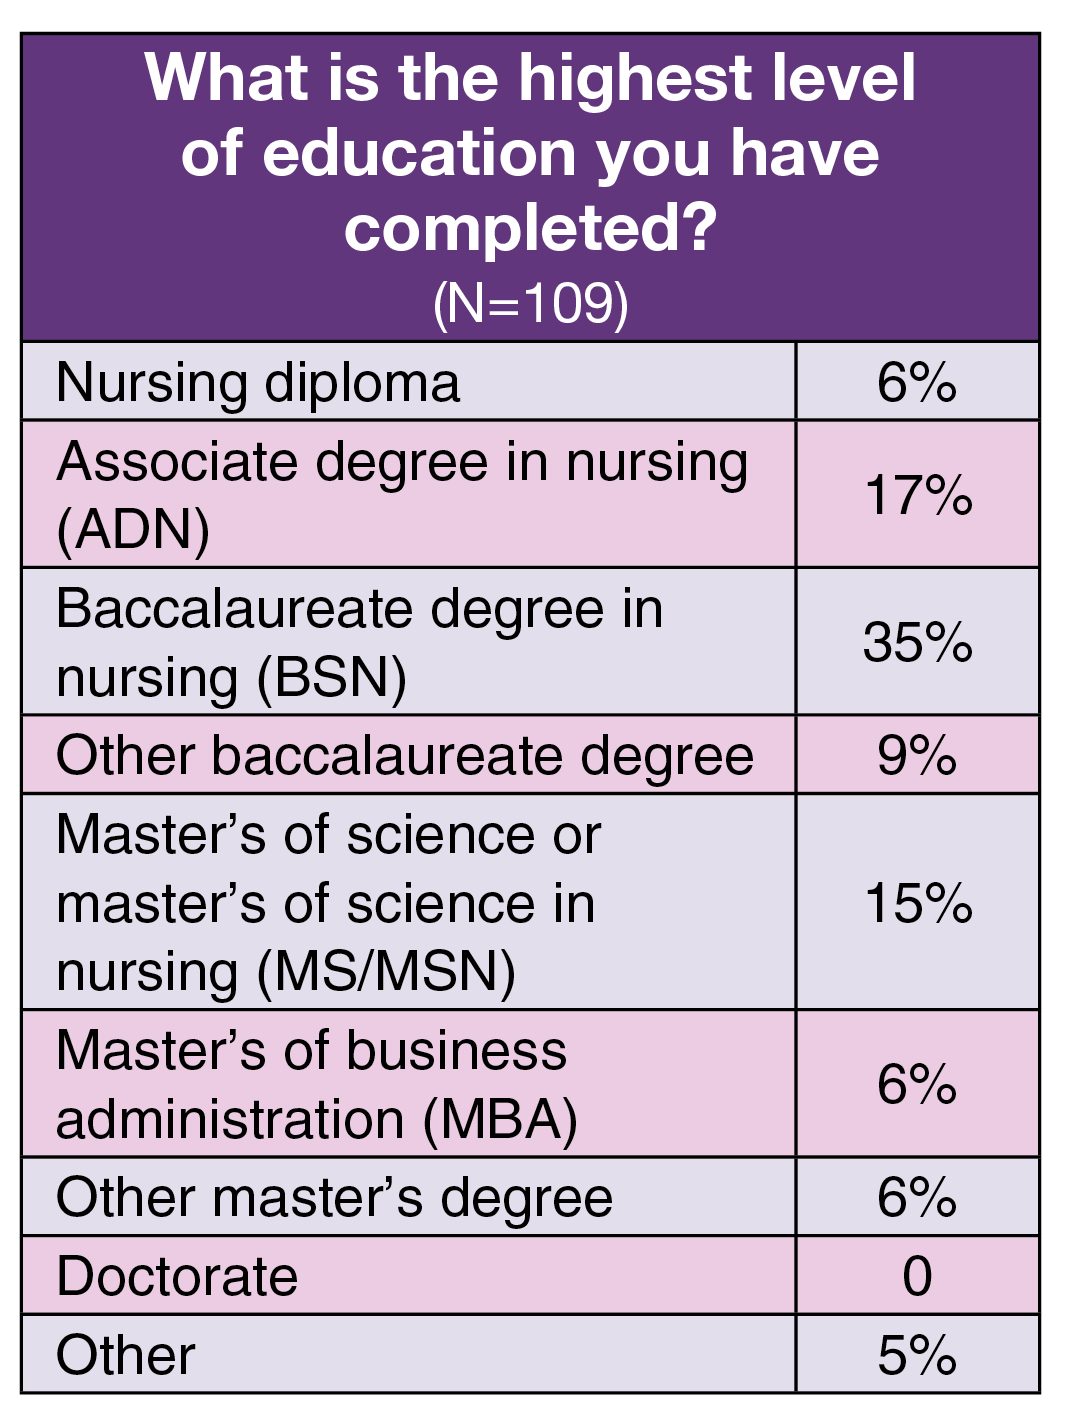
Congruent with surveys in recent years, the baccalaureate degree in nursing is the highest degree held by ASC leader respondents (35% vs 32% in 2022 and 42% in 2021). More than one-fourth (27% vs 26% in 2022 and 20% in 2021) hold a master’s degree, and 17% hold an associate degree in nursing.
More than a third (36%) of respondents live in the Midwest, 28% in the South, 21% in the West, and 15% in the Northeast.
Dangerous waters ahead
We received 101 responses to the question, “What issue facing perioperative leaders do you feel isn’t getting enough attention?” Although staffing receives daily attention in the field, most respondents still identified it as an issue needing more, with many pointing to burnout and staffing shortages. Additional comments included:
“Lack of pipeline of OR nurses, no opportunity to experience in nursing school, no clinical exposure.”
- “The amount of time and resources that it takes to fully train perioperative staff is a drain on the financial system and on the experienced staff.”
- “The new grads that have come out through COVID are not normal new grads. Many have not had sufficient clinical experience but are looking for fast track success. Many had options to take bonuses during COVID and feel their worth is more than tenured nurses who are burning out after training extremely inexperienced new grads.”
- “The landscape of nursing is changing rapidly. Employees want more time off and flexible schedules. I don’t disagree but it is hard to staff for the fluctuating census that we have.”
Many respondents also noted challenges affecting nurse leaders more directly. Sample comments related to this issue included:
- “Burnout is a real issue. I am struggling with my own mental health trying to balance ‘business as usual’ and assume the responsibilities of vacant positions, manage increased volumes, increased patient demand with reduced access, increased patient complaints r/t access, maintaining high dept. morale (especially working short staffed and increased case load).”
- “Nurse leaders don’t have the ability to make big decisions for their staff. They are told how it will be and have to almost sell it to the staff. Hard to be the middleman without authority.”
- “…[L]ack of support from upper leadership with regard to stopping excessive bookings outside of block.”
- “There is a lack of leadership training for novice leaders.”
Other issues identified by respondents included supply chain and medication shortages, more regulations, and budget constraints.
One respondent summed up several of these issues: “Nursing shortage is VERY real. We need to think and act differently and adapt to new reality. Financial component of nursing salaries needs to be removed from institutions and other avenues explored, i.e., fee for service and reimbursement. Also, competition between hospital systems and free-standing centers is increasing. Nurse leaders need to have more control to incorporate innovative methods and collaborate with surgeons to change the present environment.”
Ongoing pressures
Although this year’s survey showed a slight increase in salary, the increase has failed to keep pace with inflation, leaving many ASC leaders inadequately compensated. This despite the fact that their span of control has increased, and they are facing enormous staffing pressures. In addition, many leaders will be retiring in the near future, creating a leadership gap. Although job satisfaction is still high, it remains to be seen how long this can be maintained given the current healthcare environment. ORM
—Cynthia Saver, MS, RN, is president of CLS Development, Inc, Columbia, Maryland, which provides editorial services to healthcare publications.
Reference
Smiley R A, Ruttinger C, Oliveira C M, et al. The 2020 national nursing workforce survey. J Nurs Reg. 2021;12(1):S1-S96.
Business manager profile
The percentage of respondents with a business manager was 37%, down slightly from 43% last year, but comparable to the 38% in 2021 and 36% in 2020. Here are some key results.
Requirements
- Only one third of OR leaders require business managers to have a clinical background, down from 46% last year, but slightly higher than 2021’s 26% and 2020’s 29%.
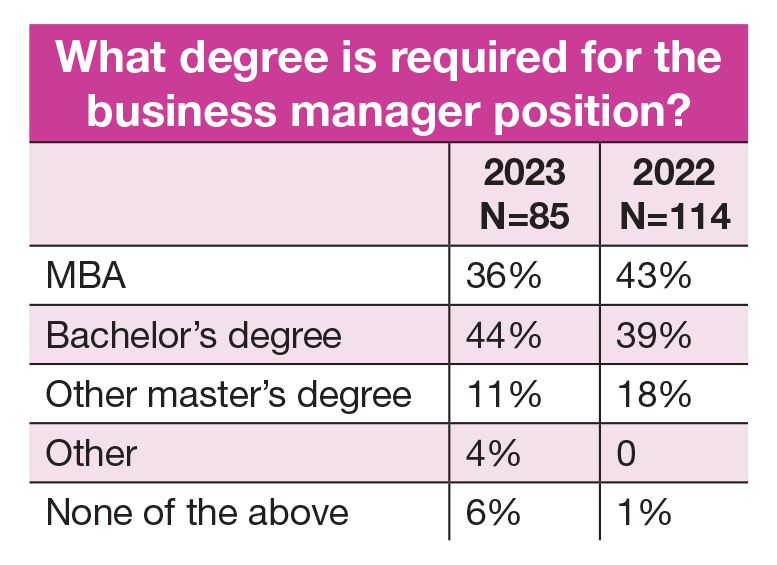
- The most common degree requirement for business managers is a bachelor’s degree (44%), with 36% required to have a master’s degree in business (down from 43% in 2022, but up from 31% in 2021). Slightly less than half (47%) are required to have a master’s degree, down from last year’s 61%.
Salary
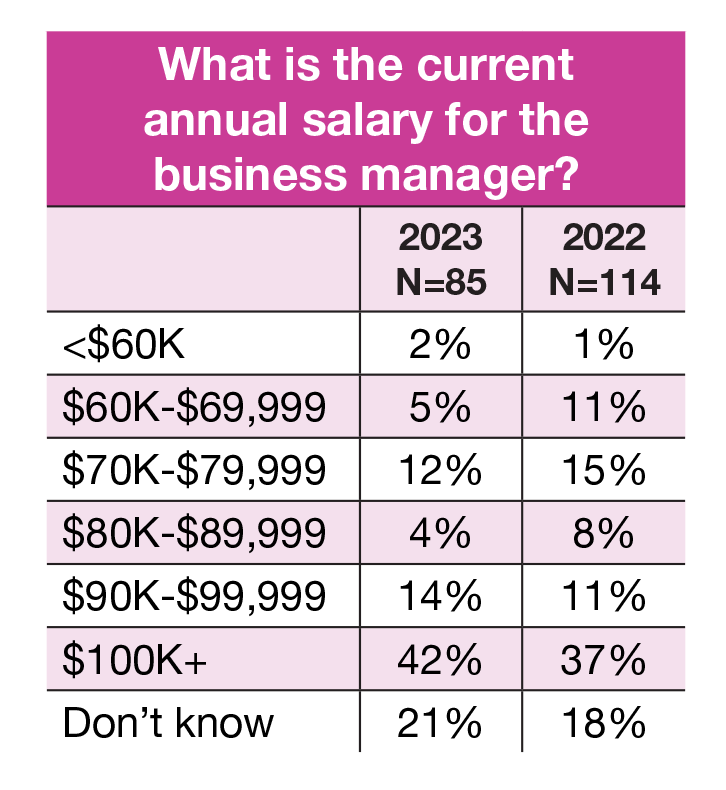
- Business managers’ salaries have remained fairly stable over the past few years. Slightly half (42%) of respondents reported their business managers earned $100,000 or more, compared to 37% in 2022 and 40% in 2021.
- The second more common reported salary range was $90,000 to $99,999 (14%), followed by $70,000 to $79,999 (12%).
Responsibilities
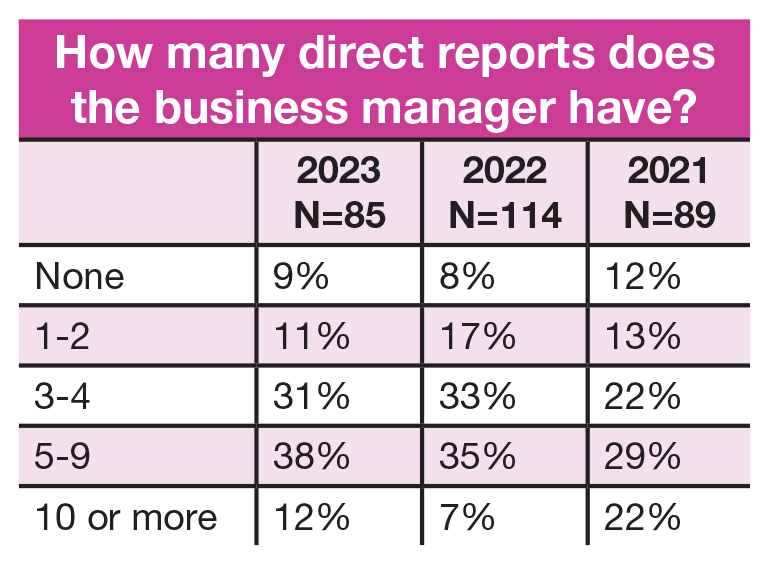
- The number of direct reports for business managers has been trending upward over the past few years, but the rate of increase slowed slightly. More than a third (38%) have 5 to 9 direct reports (vs 35% in 2022 and 29% in 2021), and 31% have 3 to 4 (vs 33% in 2022 and 22% in 2021).
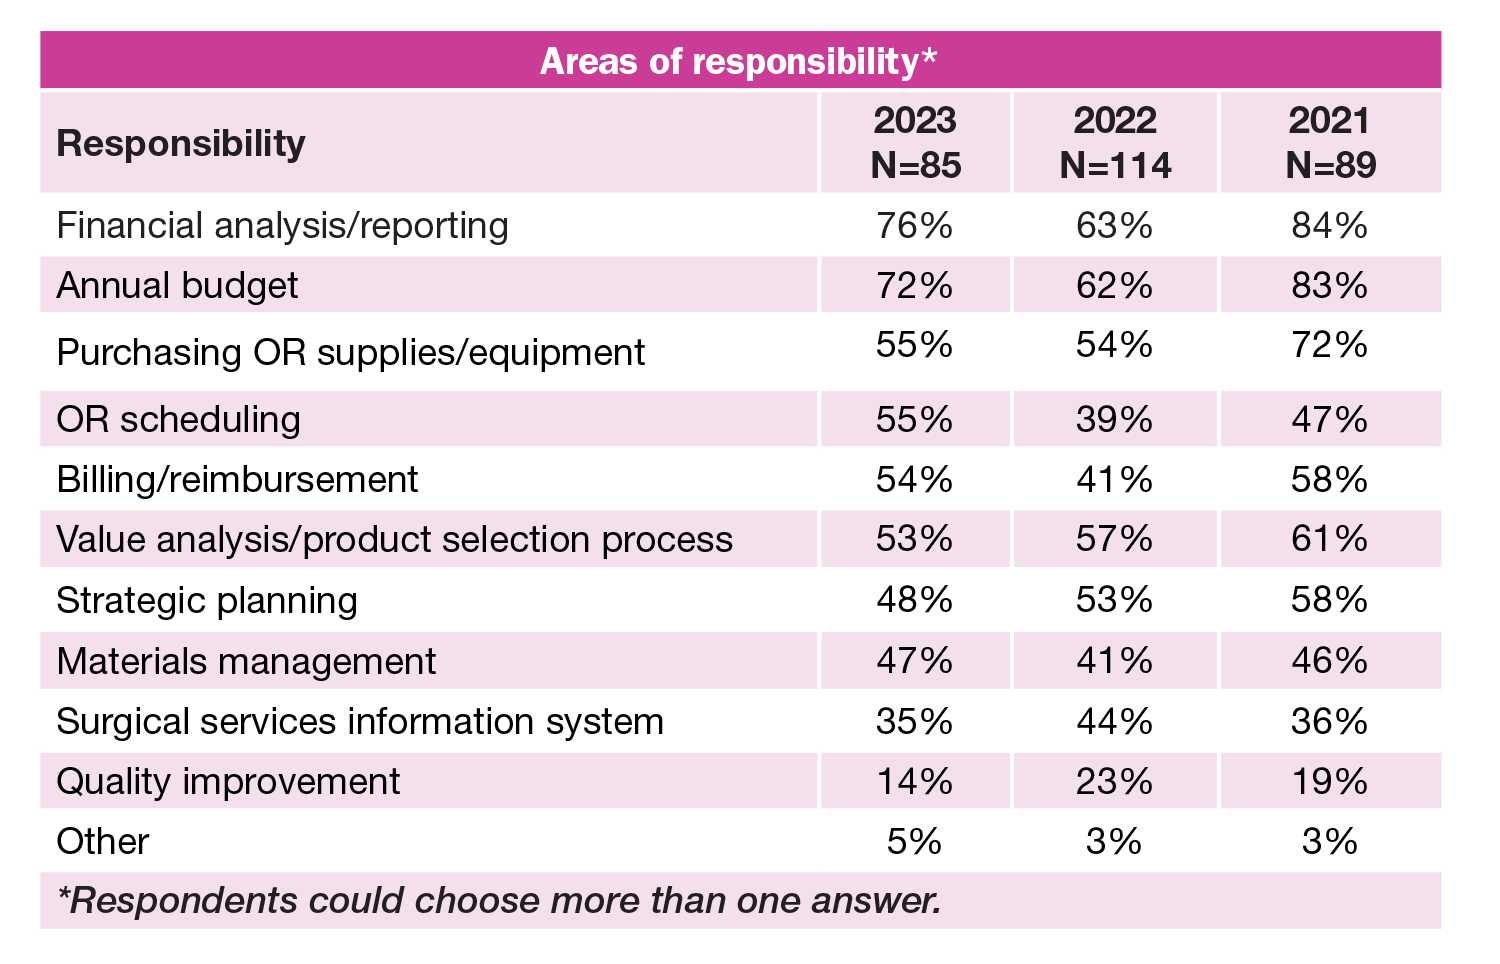
- The top three areas of responsibilities for business managers were the same as last year: financial analysis and reporting (76% vs 63% in 2022), annual budget (72% vs 62%), and value analysis and product selection process (53% vs 57%).
- Interesting shifts from 2022 include increased percentages for OR scheduling (55% vs 39%) and billing/reimbursement (54% vs 41%) and decreased percentages for surgical services information system (35% vs 44% and quality improvement (14% vs 23%). In each case of decreased percentage, the current percentage is comparable to results from 2021 and 2020.
Maximizing productivity measurement
By Cynthia Saver

For most perioperative leaders, discussions about productivity do not top the list of enjoyable parts of the job. For many, productivity is not even a topic area where they have much experience.
Yet perioperative leaders must frequently answer questions from those in senior leadership positions who consistently look to boost productivity as a means for achieving financial goals. Too often, the answers these leaders provide are not well received by senior leadership.
Brian Dawson, MSN, RN-BC, CNOR, CSSM, points to one main reason for the disconnect: “Perioperative services is not like any other nursing location, so there are no national benchmarks for productivity in OR areas.” Dawson, who is system vice president for perioperative services at CommonSpirit Health in Chicago, adds that given this gap, senior leadership frequently turn to consultants for advice on benchmarks, but that advice might not be valid. In many cases, consultants do not have evidence-based data to back up recommendations, yet organizations often accept them as fact.
In response to a question in the 2023 OR Manager Salary/Career Survey that asked about productivity measurement, many leaders agreed with Dawson about the uniqueness of the perioperative setting, noting that productivity tools and performance indicators often do not reflect the setting’s complexity.
So how can perioperative leaders make productivity measurement work for them? This two-part series is designed to help perioperative leaders measure productivity effectively, analyze results, and communicate with the C-suite so that productivity can be a tool and not a burden. This article focuses on the value of measuring, challenges, and making decisions about what should be assessed, as well as on the analysis of productivity data, the role of technology, and communicating results to key stakeholders, such as staff and top leadership..

Brian Dawson, MSN, RN-BC, CNOR, CSSM
Aaron Zachary Hettinger, MD, MS

Lydia Casteel, MSN, RN, CCRN
Lydia Casteel, MSN, RN, CCRN

Edna Gilliam, DNP, MBA, RN, CNOR
Edna Gilliam, DNP, MBA, RN, CNOR
Why measure productivity?
Productivity measurement has value because it impacts an organization’s bottom line. “Accurate productivity measurement helps us have the right staff in the right place at the right time to take care of our patients,” says Lydia Casteel, MSN, RN, CCRN, director of nursing for surgical services at Wellstar Paulding Medical Center in Hiram, Georgia.
Measuring productivity has value, but it also comes with an array of challenges, starting with the difficulty of accurately reflecting the work conducted in the perioperative setting. For example, a common measure of productivity is the number of trays processed by the sterile processing department (SPD), but this measure fails to account for the complexity of each tray.
Another example is OR staffing. “In any active OR, you need a nurse and a surgical tech,” says Edna Gilliam, DNP, MBA, RN, CNOR, assistant vice president for perioperative services and SPD for Nemours Children’s Hospital in Wilmington, Delaware. “Regardless if that room is running 10 minutes or if it’s an add-on room, you have to have staff on standby for urgent or emergent cases.” Gilliam oversees the Delaware Valley region of the system, including the main hospital.
Other challenges include productivity measurement tools that are cumbersome to use. When data are pulled from the electronic health record (EHR), it may be inaccurate—the EHR might not have the capability to generate a useable report, and clinicians who complain about the length of time it takes to document in the EHR may take shortcuts and not provide complete information.
Finally, Gilliam says the nature of the perioperative area makes it challenging to “tell our story” to those in the C-suite. Read on to explores ways to overcome this challenge.
Who decides?
Who decides what productivity measures should be followed? Many organizations use multidisciplinary committees. For instance, Casteel says measures are established each year at the system level of Wellstar Paulding as part of the budgeting process. To develop the measures, each hospital’s chief financial officer (CFO), along with system workforce analytics staff, review data from the system’s operational benchmarking tool and obtain input from nurse leaders in person and through a questionnaire.
Requested input includes information about staff responsibilities and overall composition (such as the number of anesthesia technicians and surgical technologists) and a list of other departments that receive perioperative services, such as the cardiac catheterization laboratory. “The process gives us the opportunity to share that we have a new service line we are adding, or that we expect a higher level of acuity,” Casteel says. “We can then incorporate our needs into the budget.”
Dusty Clegg, MS, RN, operations officer for the Canyons and Desert Regions of Intermountain Health (based in Utah), says the surgical operations leadership for the regions determines key performance indicators. The group comprises Clegg, the senior medical director, the anesthesia medical director, and the nurse executive director. “We give broad goals, which they [perioperative leaders] implement in their own organizations,” she says.
Gilliam says Nemours also uses a multidisciplinary approach. The perioperative operations committee, which consists of OR, physician, and anesthesia leadership, meets to establish annual goals and metrics for the perioperative department. An example is compliance with preoperative chlorhexidine gluconate bathing within a specified time frame, which is part of the bundle for preventing surgical site infections.
Those on a committee must contend with tools available to the organization. Jessica Gruendler, DNP, RN-BC, CPHQ, CNOR, senior director of nursing operations and perioperative services at Dignity Health in San Francisco, says productivity measures are partly driven by the metrics in the commercial software the organization uses. Metrics, which are related to volume and efficiency (such as first case on-time starts, block utilization, and turnover time), are sent to her and senior leadership.

Dusty Clegg, MS, RN
Dusty Clegg, MS, RN

Jessica Gruendler, DNP, RN-BC, CPHQ, CNOR
Jessica Gruendler, DNP, RN-BC, CPHQ, CNOR

Jodie Lockwood, MSN, RN, CNOR
Jodie Lockwood, MSN, RN, CNOR
What to measure?
Leaders must weigh several factors when choosing productivity measures. Selecting too many creates a burden on those responsible for analyzing the data and adjusting as needed.
In cases when manual data collection is necessary, care must be taken to not overburden staff. In addition, when patients are involved, Casteel says, “Some measure of acuity must be built into productivity so we can make it as accurate as possible.” That can be difficult because acuity tools are lacking for preoperative areas, although Casteel is able to access an acuity tool for postanesthesia care unit (PACU) patients though the EHR.
The most important consideration when choosing a productivity measure is why it is being measured—its impact on achieving overarching goals. “You have to decide why you have a metric,” Clegg says.
For example, many organizations measure first case on-time starts, but Clegg says this measure does not affect the bottom line unless delays are so long that reducing them allows the organization to add another case or reduce overtime, which is rarely the situation. That is not to say delays are not worth looking at. “If we take patients back to the OR 20 minutes later than when we said we would, we get complaints, so that’s a patient experience issue,” Clegg says. Therefore, if one of the 24 hospitals in the Canyons and Desert Regions of Intermountain Health falls below 60% for on-time starts, leaders at the facility are tasked with improving the metric.
When looking at improving on-time case starts, Clegg says the most value comes from examining cumulative tardiness over the course of a day, which incorporates the longer-term impact of on-time starts. For example, a surgeon who consistently schedules cases for shorter than they take will cause more and more delays as the day progresses. “In this case, reducing delays will save money and improve efficiency,” Clegg says.
Recently, the organization conducted a trial at a level 2 trauma hospital in Southern Utah; cumulative tardiness revealed that the OR was running late 64% of the time, with an average of 35 minutes per delay. Leaders used the average actual time related to scheduling several types of orthopedic cases (total hips, total shoulders, total knees, and unicompartmental knees) to improve accuracy with scheduled case time. The trial reduced delays in 50% of all cases, and the average amount of delay fell to 15 minutes. In fact, total hip cases went from 40 minutes late on average to 5 minutes late on average.
“Tracking what your average scheduled time is versus your actual time and then working with providers to help them understand that they’re scheduling an hour and a half for total hip, but their data show they take 2 hours helps get future cases scheduled correctly,” Clegg says.
Correct scheduling of procedures promotes downstream efficiency (eg, having appropriate PACU staff) and reduces bottlenecks in the preoperative area. Accurate scheduling “also helps make the end of the day more consistent so there is less call utilization and asking caregivers to stay late, which means less premium pay,” Clegg says.
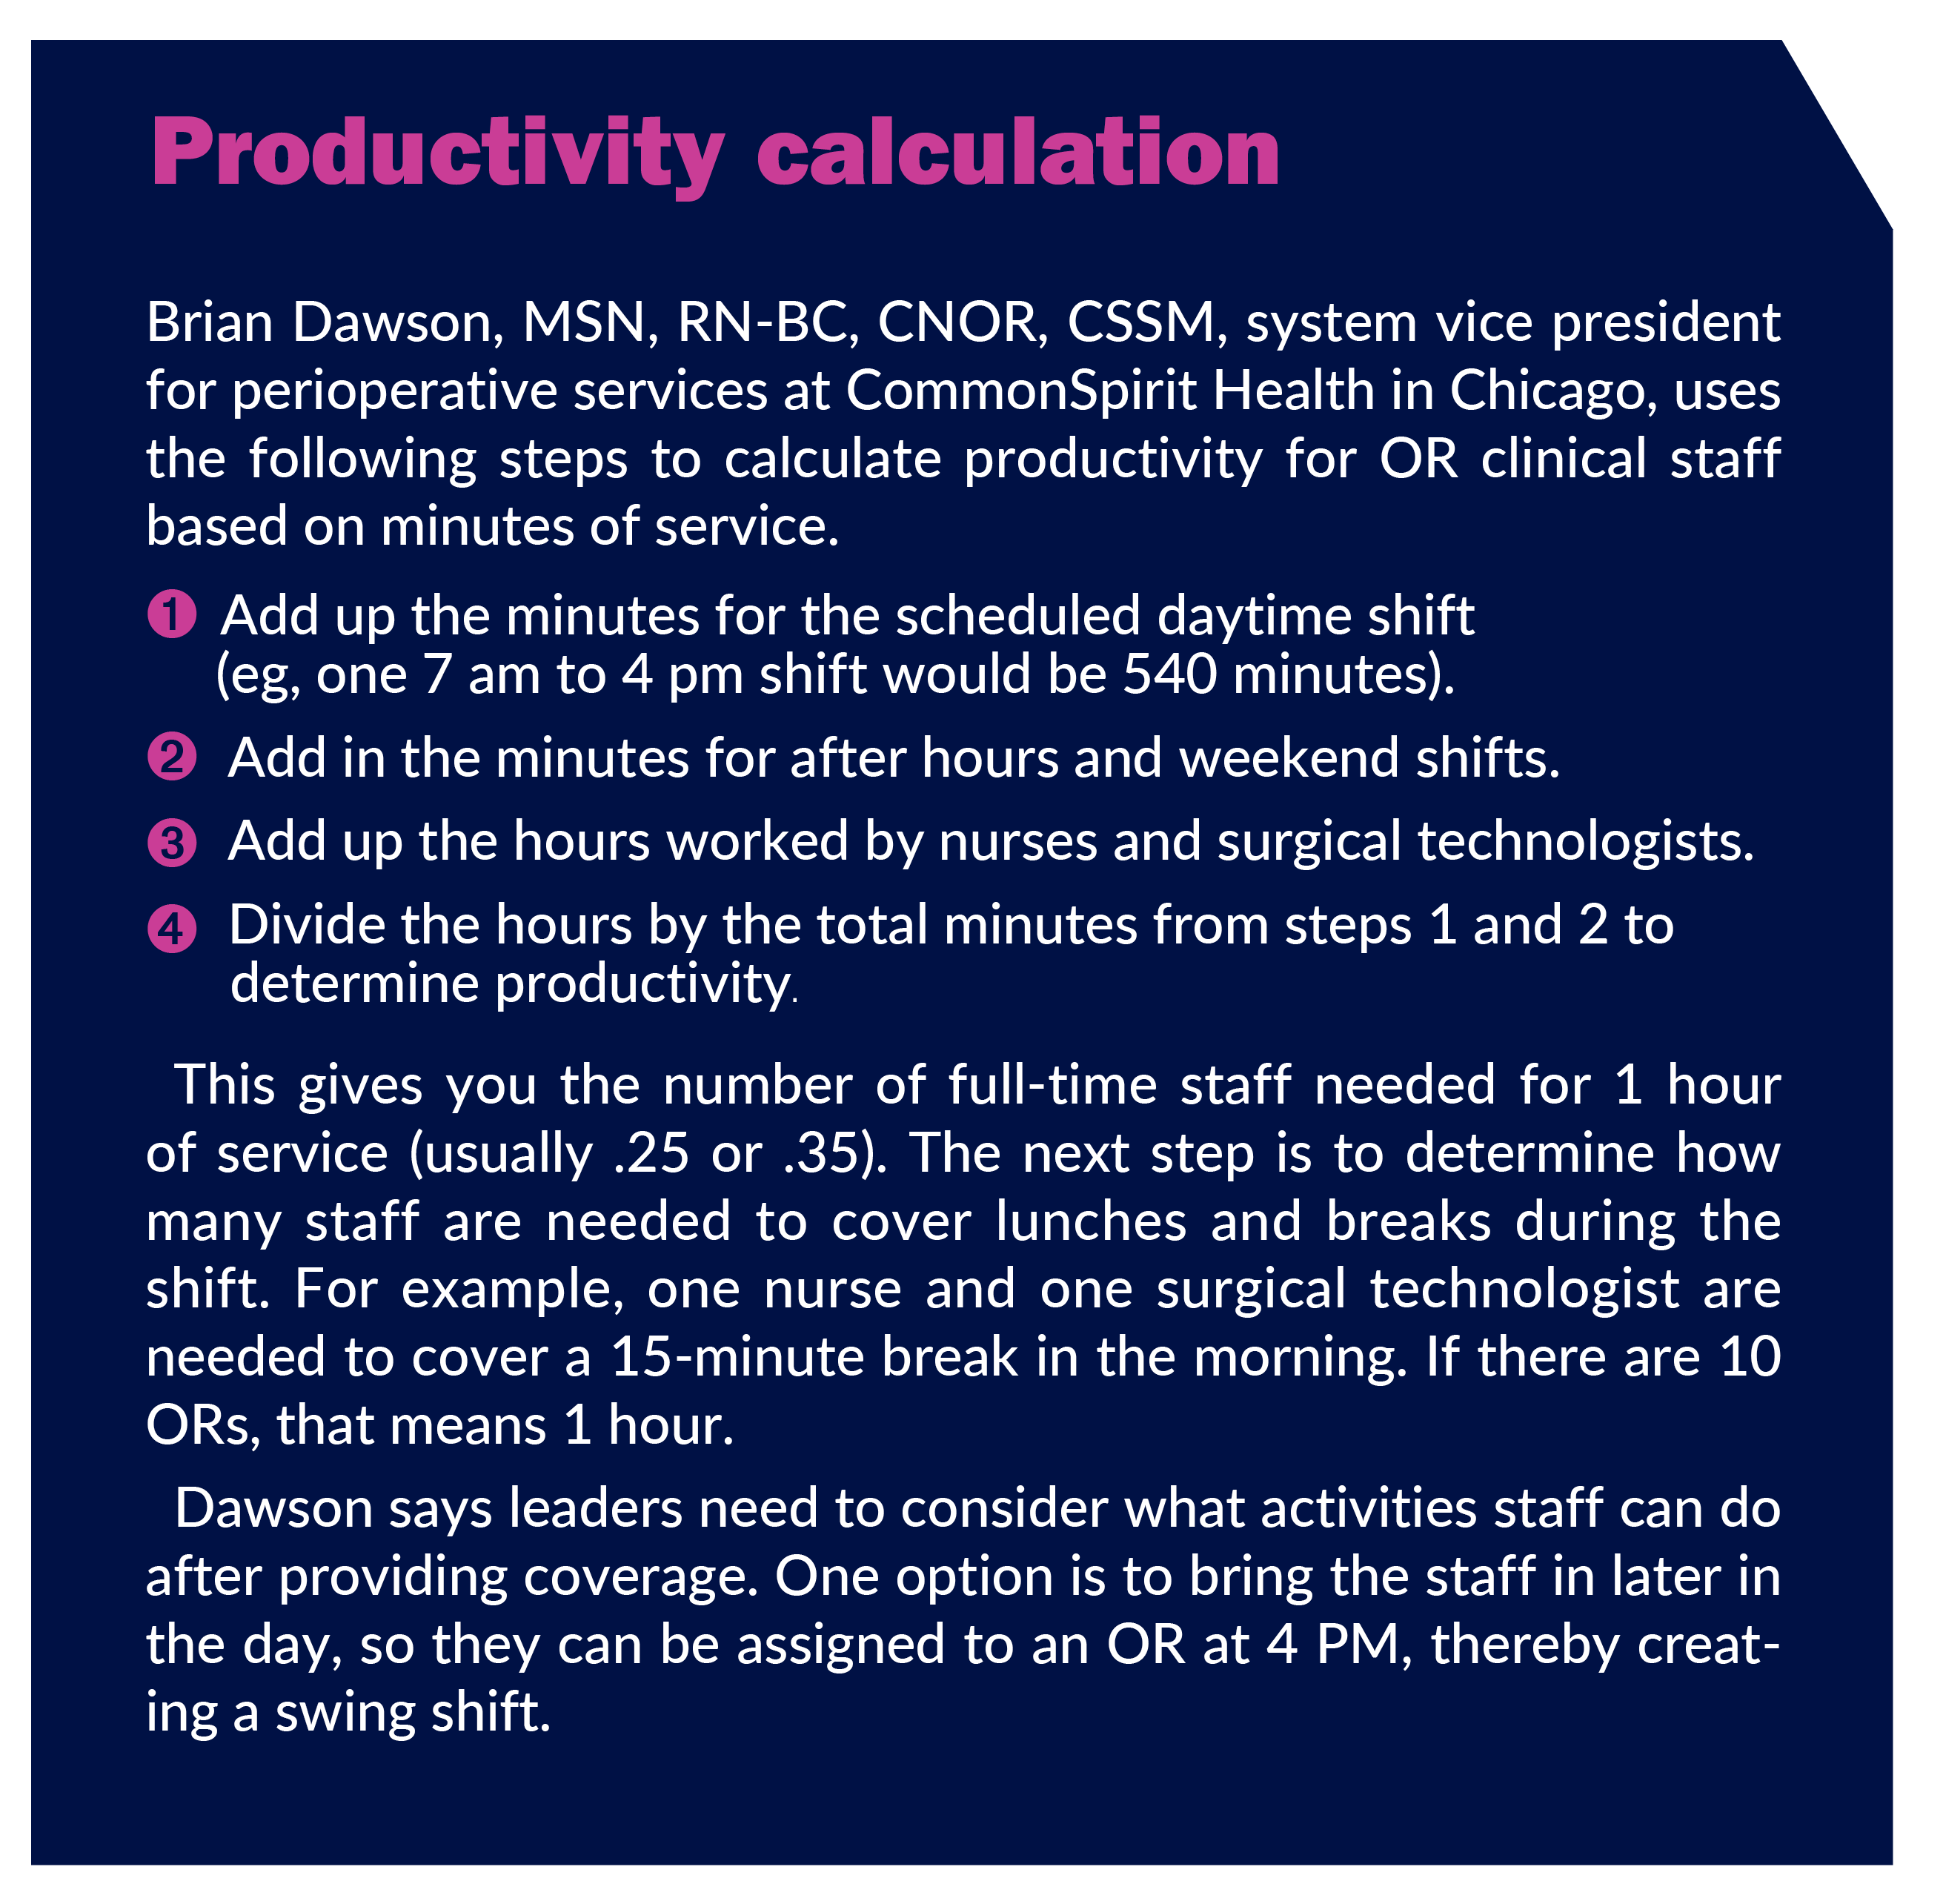
Productivity measures include those specific to the process of the work setting (such as the OR vs SPD), those related to patients (such as patient satisfaction), and those related to staff (sidebar, Productivity and staff). Here is a closer look at variations in work settings across the perioperative continuum.
Preadmissions testing. “Preadmission testing (PAT) is often overlooked in productivity models,” Gruendler says, adding that an efficient PAT phone call takes an average of 45 minutes and longer for patients older than 60 years, who often have multiple medications and complex medical histories.
Rather than having nurses in the preoperative area make those calls, Gruendler set up a separate call center at Dignity Health, which improves efficiency. “If preadmission testing is functioning well, you can bring patients in an hour instead of 2 hours ahead and improve preoperative productivity,” she says. Dignity Health uses the number of patient encounters for the day as the productivity measure for this area.
Preoperative area. This area can be viewed as a clinic, so when determining productivity, Dawson and Gruendler look at the number of nurse-patient encounters and how many nurses are needed to manage those encounters. Timing is an important factor, with more staff needed early in the day to prepare patients for surgery, but fewer needed later in the shift.
Dawson says that although some staff can make preoperative and postoperative patient calls during the slower time, staff are also cross trained in the PACU, so they can work in that area as needed. At Wellstar Paulding, Casteel uses 2.3 hours of service needed per patient hour in the preoperative area.
Some hospitals are experimenting with different types of metrics in this area. For example, Clegg says Intermountain Health is starting to look at the time the patient arrives at the hospital, the time the patient is ready for surgery, and the time the patient is transported to the OR. “We want to manage the time to avoid bottlenecks but have enough time to safely prepare the patient for surgery, ” Clegg says.
Operating room. Dawson at CommonSpirit recommends minutes of service—how many minutes the patient is in the OR, from wheels in to wheels out—as the best tool for measuring productivity in the OR (sidebar, Productivity calculation). He adds that when managers and assistant managers regularly help with breaks and lunches (a practice more common in ORs of five rooms or less), fewer staff will be needed for these activities.
Many ORs also measure factors such as turnover time, first case on-time starts, cancellation rates, block time utilization, and delays (surgeons and patients)—all of which impact minutes of service. Casteel finds block utilization particularly helpful for building the staffing model in the preoperative, OR, and PACU areas. “You can look at what services you are offering on what days for how many hours for each surgeon,” she says. Block scheduling was the most common productivity measure mentioned in the OR Manager Survey.
At Intermountain Health, Clegg considers an average turnover time of 25 minutes to be a good target, with select specialties slightly higher or lower. “I don’t want turnover time to be too fast because that’s dangerous,” she says. Perioperative leaders can compare their metrics such as turnover time with other, similar hospitals in the system.
PACU. Dawson says the minutes of service approach used in the OR also applies to PACU. A challenge unique to PACU are extended stays for patients who are no longer Phase 1 but must remain in the PACU because no unit bed is available. “You need to look at the acuity level of those patients,” Dawson notes. If patients would have been transferred to a medical/surgical unit, the ratio can be one nurse to four to five patients. “You have to account for the time in extended stay,” he says.
Jodie Lockwood, MSN, RN, CNOR, perioperative nurse manager at Nemours Children’s Hospital, uses the average time a patient is in the PACU (from entry into Phase 1 to exit out of Phase 2) as a baseline measure. She compares this to an EHR data report that lists each patient (including procedures performed) that each nurse cared for, so individual productivity can be evaluated in the context of acuity. “Drilling down to individual nurse data allows us to benchmark mean times and identify outliers,” Lockwood says. “It also helps us identify nurses who do things really well, so they can be champions and help staff who may have challenges.”
Measuring PACU length of stay helped the hospital reduce it by almost 10% in the past year by implementing various strategies, such as improving the communication of discharge readiness from nurses to physicians. For example, nurses now use a timestamp to notify anesthesia when a patient is ready to be moved from Phase 1; the timestamp is visible on a status board in the OR. In addition, rounding by patient-flow supervisors (and later charge nurses, who were trained for the task) helps promptly identify a patient who is ready for a change in discharge status.
Gruendler says Dignity Health has found the number of patient encounters per day in the PACU to be a helpful productivity measure. Casteel at Wellstar Paulding uses the figure of 3.7 hours of service per patient hour, depending on acuity. PACU nurses document acuity via a scale in the EHR. Managers can share this information with the CFO to support variances. The 3.7 figure encompasses not only nurses, but others involved in caring for the patient, including transporters and nursing assistants.
Linking OR volume to PACU care is a productivity measure that can help with staffing. Gilliam says Nemours added an additional OR for ENT surgery to manage increased post-pandemic volume. By tracking timing through the process, she was able to justify additional full-time employees for the PACU.
SPD. Dawson says that minutes of service does not work for the SPD as a productivity measure because the length of time it takes to process instruments varies considerably among cases. In addition, the complexity of instrument processing is why counting number of trays processed also does not work. Instead, Dawson uses AAMI’s four levels of complexity related to what SPD staff members do. Each level has an associated time, and the levels include ancillary tasks such as setting up case carts.
Tracking these tasks would be burdensome for staff, which is where an instrument tracking system comes in. Staff scan a bar code on an instrument set when starting cleaning and when finished cleaning. The time can be linked to a level of complexity. “Now I can right-size SPD staffing,” Dawson says. That includes determining if a regular night shift or weekend shift is needed, or if having staff on call is a better option.
Clegg at Intermountain Health says another measure of productivity—and patient safety—relates to immediate use sterilization (IUSS). At one point, some OR sites had levels as high as 30%. One facility identified that the cataract instrument set had the highest IUSS rate; increasing the number of sets decreased the rate significantly. The SPD and OR leadership teams at each facility now meet monthly to review the IUSS rate and determine what instruments need to be purchased to reduce the rate. Currently, the rate for hospitals in the Canyons and Desert regions is less than 2%.
The plan for next year is to reduce the size of instrument sets. “About 30% to 60% of instruments in a set aren’t used, but they get processed over and over again,” Clegg says. Reducing the number could have a significant impact on productivity.
Gilliam adds that it is important to not only consider the support SPD provides the OR, but also the support provided to the entire organization, including, for example, endoscopes processed for various clinics.
Productivity measurement directly relates to asset management. “Ask how well you are managing the assets of the various departments,” Clegg says. In addition to answering that question, perioperative leaders must be able to analyze productivity reports and communicate key findings to staff and senior leaders.
Analyzing productivity data
Questions to consider when analyzing productivity data include: What level of productivity should perioperative leaders target? What are the comparison data?
To answer the first question, Casteel, uses benchmarking reports from Vizient, which notes that scores below the 40th percentile correlates with effective productivity. “You want to be sure you’re in that sweet spot for productivity,” she says.
The ideal productivity level is 100% to 108% but the percentage will fluctuate. For instance, Casteel says that on Tuesdays, the number of cases are lower, but they are longer and more complex, which results in lower postanesthesia care unit (PACU) productivity. However, Wednesdays bring higher PACU productivity because there are more shorter cases, such as GI and urology. Therefore, Casteel recommends that in addition to reviewing daily data, leaders should review trends over six pay periods. She recommends leaders avoid dipping below 95%. On the other hand, “If you’re consistently above 120%, you need to ask why,” Casteel says. Productivity may be higher because someone was on family leave or out sick, which reduces the number of staff. While a 120% productivity report might seem like good news, if sustained for too long, staff will feel overworked and could leave the organization. For that reason, Casteel says consistently high productivity percentages could indicate an inappropriate staffing model.
Benchmarking with national data can be helpful in answering the second question related to comparison data. For example, Gilliam says the hospital reports data to the Children’s Hospital Association (a collaborative of more than 220 children’s hospitals that seeks to improve child health) and receives quarterly reports in return. “We look at the reports to see how we measure up to other children’s hospitals,” she says.
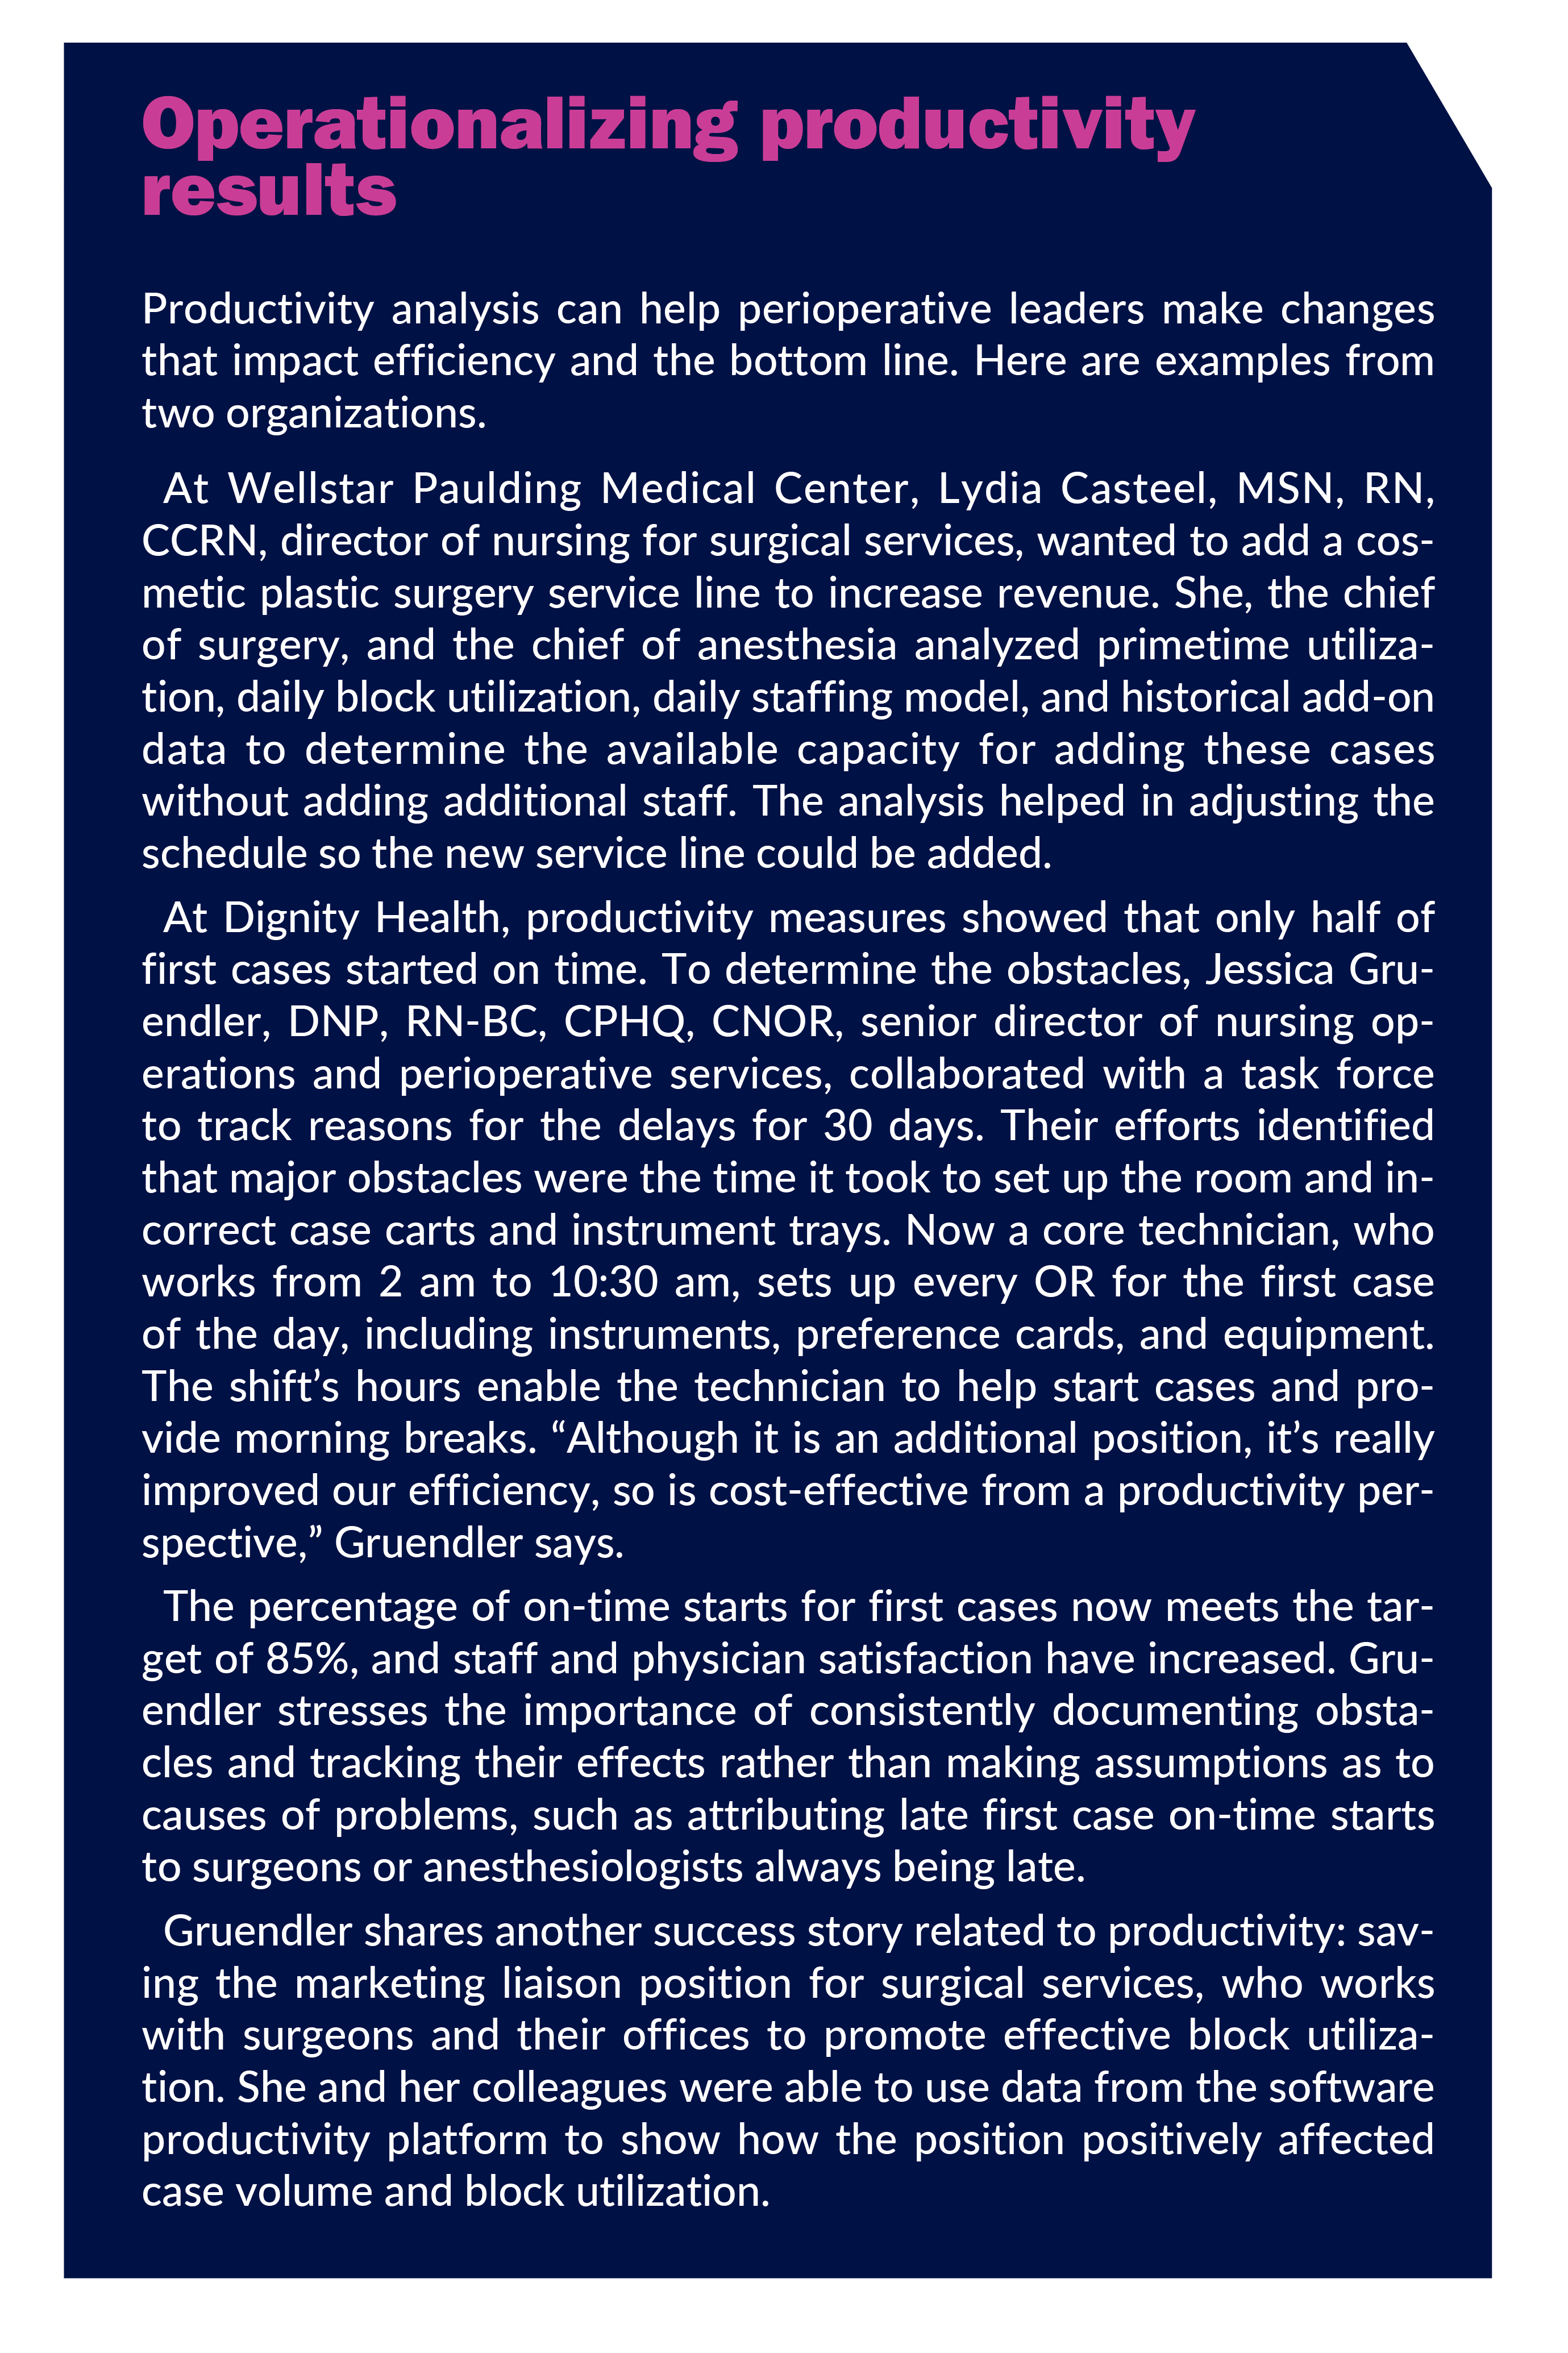
In general, however, national comparison data for the perioperative setting are lacking, according to Dawson. Instead, healthcare systems may choose to compare hospitals within the system. The goal of data analysis is to use the results to improve care (sidebar, Success stories: Operationalizing productivity results).
Technology’s role
Technology can provide information related to factors such as capacity and patient flow that can be used to facilitate productivity measurement and foster better business decisions. “The newest technology gives leaders real time and predictive information so they can better plan and identify windows of time, which are opportunities for more cases,” says Shawn Sefton, MBA, BSN, RN, a perioperative consultant. “It can help us understand our business much better.” Sefton was chief nursing officer and vice president for clinical solutions at Hospital IQ, which was acquired by LeanTaaS in January 2023.
That understanding helps OR leaders ensure they have the right resources at the right time. For example, when OR leaders can predict the types of cases coming up, they can staff rooms with employees who have the competencies needed for those cases. Leaders also can adjust block schedules to optimize utilization. Sefton says these types of features help leaders present a business case for purchasing a system. If, for instance, utilization is below target, being able to predict where additional cases can be scheduled and how to use staff most efficiently will increase revenue. In essence, the technology can help optimize OR management, which will improve margins and gain the attention of those in the C-suite.
Many organizations pull productivity measures, such as first-case start times and turnover times, from electronic health records (EHRs). Software that provides operational data is usually focused on inpatient units, but a few commercial products can be helpful in the perioperative setting. One option is iQueue for Operating Rooms (LeanTaaS), which CommonSpirit has purchased. The product helps the organization establish realistic productivity standards and staffing for various hospitals. For the SPD, Nemours Children’s Hospital uses SPM Surgical Asset Tracking Software (Steris), which includes a dashboard that measures productivity. Technology tools may be subscription based (factoring in the number of ORs), and some offer different modules, which organizations can add as needed to gain full integration of the patient flow.
Dawson says it pays to invest in commercial products that provide data that can be used to assess and manage productivity. For example, contracts with instrument tracking companies have helped CommonSpirit optimize staffing and save money. “[These products] cost thousands of dollars, but the ROI [return on investment] is there,” he notes, adding that it is usually cheaper for organizations to purchase a product rather than build one internally.
Sefton says another strategy for making the business case for software that provides information that helps a leader manage productivity is to share how much the OR is spending on FedEx because lack of planning led to urgent needs for instruments and other supplies for cases. The costs can run thousands of dollars; reducing or eliminating those costs can help off-set the cost of a system.
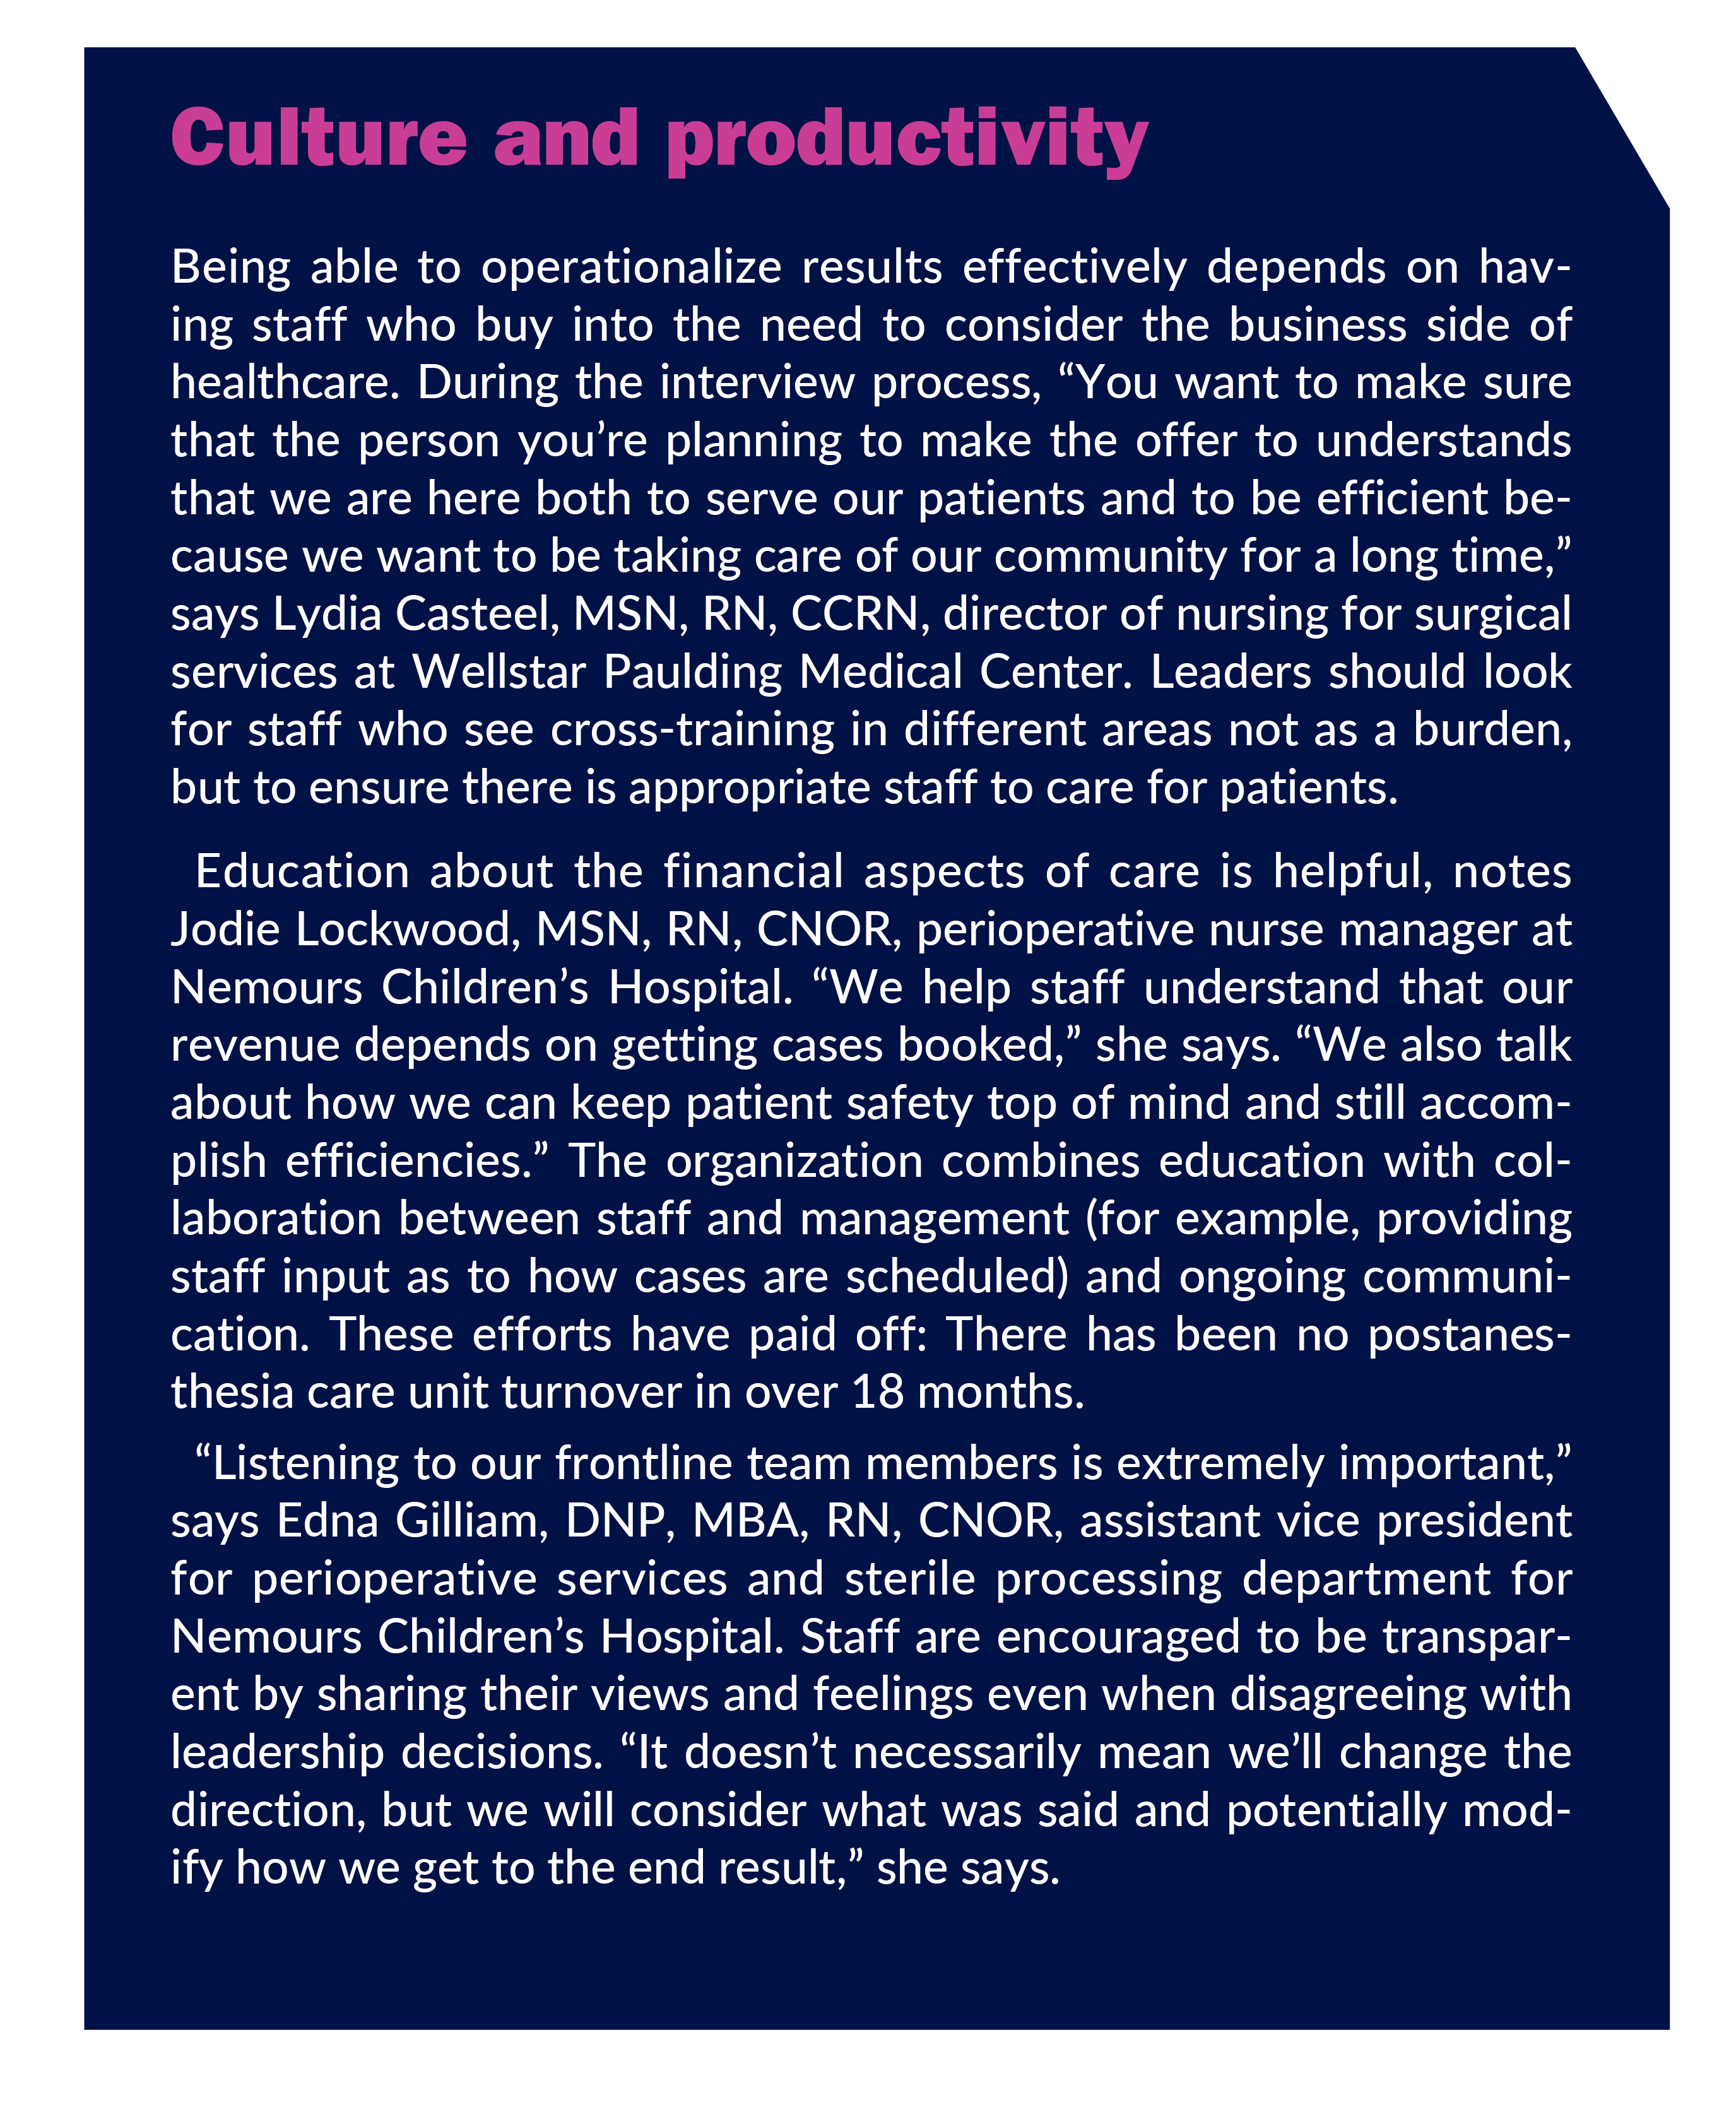
As with any new product, it is important to carefully review the software’s capabilities and usability to ensure it meets the organization’s needs. “Consider what problem you are trying to solve and whether the software will help solve that problem,” Sefton says. For example, OR leaders often want to improve prime time or block utilization. She adds that culture plays a role as well. “Those in the organization have to be ready to make the changes that are needed for the technology to be successful,” she says. For example, modifications of the scheduling process might be needed. “You want people to lean in and take advantage of what’s being offered” (sidebar, Culture and productivity).
“You want the system to be adaptable to your facility,” adds Dusty Clegg, MS, RN, operations officer for the Canyons and Desert Regions of Intermountain Health (based in Utah), which also uses iQueue for Operating Rooms. For example, reporting and scheduling functions should be intuitive to use and flexible so they can be tailored to the nuances in various facilities. “You also want transparency at the provider level,” Clegg says. Surgeons can see their block utilization on their phone and when an OR has opened up block time.
Sefton recommends leaders ask for a full demonstration of the product and select one being used by many facilities, as opposed to one in development or early release. Talking with those who are using the technology is valuable, and leaders should ask about customer support and how software updates are handled. Some companies make updates on an ongoing basis, which can help ensure the organization is getting the most benefit from the system. “You want to have a company that will partner with your organization,” Sefton says.
“You want to be a good financial steward and be sure you are getting a good ROI on the product,” Clegg says. “Ask what you are going to get out of it.” The value might come from greater efficiency, increased case volume, or decreased premium pay. Of course, the most important goal is to improve patient care. “Us
ing technology to help leaders plan their resources better brings us back to delivering exceptional patient care,” Sefton says.

Shawn Sefton, MBA, BSN, RN
Shawn Sefton, MBA, BSN, RN
Connecting with the
C-suite
“Most CEOs and CFOs don’t understand the OR because they don’t go behind the red line,” says Dawson. “Because they do not understand, they reach out to a third party to tell them what their productivity should be.” Unfortunately, Dawson says, those third parties too often provide information not backed up by evidence.
Perioperative leaders need to educate senior leadership, but they also need patience because it can take time to see results. Yet the effort is worthwhile. For example, Dawson was able to make the business case and demonstrate the ROI to CommonSpirit leadership to purchase iQueue for Operating Rooms 4 years ago. He also was able to do the same for SPD; the organization uses the CenisTrac Instrument Tracking System (Censis) to track workload and productivity data.
Pairing education with building partnerships will help perioperative leaders be more effective in productivity discussions. A good starting point is understanding senior leaders’ jobs and perspectives. “I have a very good rapport with our C-suite because I’ve made it a priority to get to know them and to understand what they are responsible for,” says Casteel at Wellstar Paulding. She reports to the CNO but works closely with the COO and CFO. On their part, senior leadership routinely make rounds in the perioperative setting. “They put on scrubs and see how we work,” she says. Casteel credits the organization’s servant style of leadership that embraces lean management for the effective partnership. “Leaders know that they have to observe so they understand the nuances of what we do,” she says.
In addition to the environment, Casteel says being able to speak in terms of data enhances her ability to obtain resources and add new service lines more quickly. “I can concisely prove my point using data,” she says. Casteel, who meets weekly with the C-suite, adds that taking an “elevator speech” approach and being prepared are keys for success. “You have to always be thinking about what you need next week, next month, next quarter, and next year,” she says. “When you have the opportunity, drop hints and keep building on that so you tell the story of what you need and keep them informed.”
Jessica Gruendler, DNP, RN-BC, CPHQ, CNOR, senior director of nursing operations and perioperative services at Dignity Health in San Francisco, says perioperative leaders need to be able to communicate the units of service for each of their departments. As noted in Part 1, these units differ by location. “You not only have to understand the complexity behind those units of service, you also have to be able to verbalize all of the other resources (such as nonclinical staff) and all of the other tasks that go into maintaining an OR,” she says. For example, schedulers are needed no matter how many cases or minutes of service there are during a day.
Gruendler also spends time helping the C-suite understand how acuity in the OR differs from patient acuity on a hospital unit. Acuity for postsurgery patients can be measured based on data from the EHR, but in the OR, acuity is based on the type of surgery. For example, a simple mastectomy might require a surgical technologist, a circulator, and two instrument trays, while a total joint might require an additional surgical technologist and 25 instrument trays. In addition, a third person in a robotics or total joint OR to help with setting up the first case and turning over the room can improve efficiency.
As with Wellstar Paulding, rounding is a key component to helping senior leadership at Dignity Health to understand perioperative departments. As part of the “Stronger Together” program, senior leadership (including the C-suite) round every day; rounds include discussing metrics being measured. Rounding assignments change weekly. “The C-suite becomes familiar not only with the complexity of the OR but the terminology,” Gruendler says.
Even with strong partnerships, it can be difficult for perioperative leaders with underperforming metrics to face questions from senior leadership. Gruendler recommends sharing efforts to address the problem. “If I can get them to understand how I am working to keep down my costs, avoid waste, and be efficient, it helps a lot,” she says.
Perioperative leaders also need to ensure they understand productivity so they can communicate effectively with upper management. “Many OR directors don’t have a good understanding of the financial and operational part of the OR because they’re so focused on the clinical,” Gruendler says. “That’s a huge knowledge gap that OR directors need to fill with education.”
The effort to build understanding can provide significant benefits (sidebar, Success story: Productivity and positive change). A year ago, Gilliam says Nemours retooled the OR education program and built pipelines with area colleges, which resulted in nearly erasing a deficit of 15 open positions. Now, however, those new nurses are completing orientation and require mentoring as they continue to learn their craft.
“I need to give them the ability to learn while also maintaining an appropriate staff mix to keep patients safe,” Gilliam says. She feels the work she has done with leadership has positioned her well to advocate to the C-suite to “overhire” slightly so veteran nurses are available to help new nurses, who will not be fully comfortable in their role for 1.5 to 2 years. The strategy also will help avoid staffing crises related to unexpected resignations or family medical leave and make it easier to reallocate staff to other locations during staffing shortages.
To encourage buy-in for the strategy, Gilliam had the vice president who gave approval visit the perioperative setting so he could see the entire process, starting with the preoperative area and through PACU. “I think he was a little overwhelmed,” she says. However, learning what new nurses would deal with gave him valuable insight into the request. “He understood that this would help to build specialty teams for highly complex patients, keep ORs open, and maintain safety parameters as we navigate a significant number of new graduate nurses in the OR,” Gilliam says.
Future directions
What is the future of productivity measurement? In this era of value-based healthcare, many surgical procedures are navigating from the more costly hospital setting to the less costly outpatient setting. And in the future, Clegg says, some of the procedures currently performed in ambulatory surgery centers will migrate to physician offices. All this is part of the larger focus on population health. “As we shift from fee for service to a population health approach, we need to look at things very differently,” Clegg says.
Under population health and value-based care, the goal is to keep patients healthy, particularly because providers receive a set amount of money, rather than being paid for services provided. Therefore, perioperative leaders must consider the procedures the hospital is doing, how they are being done, and whether the hospital is the best venue for the patient. “In the future, the goal will be to keep patients out of the OR because it’s costly,” Clegg says. “We will still look at productivity because time in the OR is very expensive, so you want to be as efficient as possible.” However, leaders also must take a wider view. “It’s not just productivity, it’s the cost of what we are doing and what value we are bringing to the patient,” Clegg says. “We have to be good stewards of the dollars we are responsible for.”
This deep-dive has covered the nuts and bolts of productivity measurement. But it is important not to lose sight of the ultimate goal of everyone working in healthcare—patient safety. “Productivity metrics are important to analyze your staffing, but my goal is determining what’s safest for my patients and what’s safest for my staff,” Gruendler says. “I have to put my patients and my staff first at all costs.”
—Cynthia Saver, MS, RN, is president of CLS Development, Columbia, Maryland, which provides editorial services to healthcare publications.
Optimizing productivity measurement in the ASC
By Cynthia Saver

Productivity is a foundational concept for leaders of ambulatory surgery centers (ASCs). “Measuring productivity is essential to be successful,” says Beverly Kirchner, BSN, RN, CNOR, CASC, chief compliance officer for SurgeryDirect, LLC, Salt Lake City, Utah. “When you’re measuring productivity, you’re looking at efficiency, which affects the types and numbers of cases you can do.”
Time invested in productivity measurement yields dividends for ASC leaders. “It helps leaders be more effective in managing staff and working with surgeons,” says Becky Ziegler-Otis, MHA, CASC, RHIA, CPHQ, CHC, an ASC healthcare consultant in Plover, Wisconsin, and a member of the board of directors for the Ambulatory Surgery Center Association (ASCA). Ziegler-Otis also is assistant executive director for the ASC Quality Collaboration, which partners with outcome measure developers and payers on measure development projects impacting the ASC industry. “Productivity measures can help you assess processes that impact center operations and help pinpoint and focus efforts on what needs attention.” For example, a leader who identifies under-utilized block time might learn that the problem is not lack of volume from the surgeon, but rather that the surgeon’s office staff finds it cumbersome to schedule cases with the ASC. Smoothing the process could increase volume.
But productivity measurement is not without its challenges, as indicated by results from the 2023 OR Manager Salary/Career Survey. In response to an open-ended question, respondents cited issues such as difficulty in obtaining data and lack of time. (For more information, return to the survey results also included in this digital booklet) To overcome these challenges, ASC leaders need to establish a measurement process that is both effective and efficient, and they need to closely analyze and communicate results.
Productivity process
A recurring productivity theme from ASC leaders is to “keep it simple.” Start by looking at the big picture, then drill down as needed. “The more complex you make the information gathering, the more likely an error is going to creep into it,” says John Goehle, MBA, CASC, CPA, chief operating officer for Ambulatory Healthcare Strategies, Inc, in Rochester, New York, and host of The ASC Podcast. Kirchner agrees, adding, “If you ask staff to track every time they pick up the phone to make a preop call to a patient and the end time, you’ll never get accurate numbers.”
Ziegler-Otis says ASC leaders should realize that they do not have to be looking at multiple metrics all the time. “If you’ve been tracking a lot of metrics, it’s easy to get data analysis paralysis,” she says. She recommends focusing efforts and working on improving a few key measures at a time. Ziegler-Otis says this approach aligns productivity metrics with continuous quality improvement principles.
Kirchner adds that productivity goals, quality goals, and patient satisfaction are all linked. “When we look at productivity, we want to make sure we don’t cut staffing so short that we’re not delivering quality care, or that the patient feels they didn’t receive individualized care that met their needs,” she says.
What to measure
“The most important productivity measure for ASCs is nurse staffing,” Goehle says. “How do we staff efficiently?” To answer that question, he recommends ASC leaders use a simple measure: clinical hours per case. “It is one of the most useful tools and one of the easiest to calculate, but it can be very powerful,” he says (sidebar, Calculating hours per case).
This simple calculation has several advantages. First, it does not require obtaining information from an electronic health record (EHR), which many ASCs still lack. Second, it avoids more complicated calculations that ASCs may not have the resources to perform. And third, ASC leaders can use historical data to make the calculation and establish trends. “Every surgical center in the country can use clinical hours per case,” Goehle says.
Kirchner also uses hours per case as the primary productivity measure, but she includes nonclinical staff in the calculation. She tracks productivity daily but primarily focuses on monthly results. “If we keep our staff hours per case at 12 or less, we are profitable that month, our patients don’t complain, and our staff have gotten their hours,” she says. The data are kept in an Excel sheet for easy reference, and an iris recognition time clock helps ensure accuracy of staff hours.
Rena Courtay, MBA, BCN, RN, CASC, CPPM, CNOR(e), does not include nonclinical staff such as schedulers in productivity measures. “Those positions don’t change on a daily basis the way clinical staff do,” says Courtay, who is assistant vice president for perioperative ambulatory surgery at Duke Health and an ASCA board member. Instead, nonclinical staff are considered a fixed cost, so part of the annual budget process is determining the appropriate number for the anticipated volume.
For OR staffing, Courtay uses the formula of 2.5 fulltime equivalent employees (RNs and surgical technologists) for each OR. “That will cover you for nonproductive hours such as meetings and for things like breaks and lunch,” she says.
For the most part, ASCs do not have detailed productivity measurements for the postanesthesia care unit (PACU) or sterile processing department (SPD). “That isn’t information that’s easy to gather and benchmark nationally,” Goehle says. Duke uses number of trays processed for the SPD, but Courtay acknowledges it should not be the sole measure because it fails to account for the complexity of processing some trays. She adds that keeping up with the increasing volume of trays as surgical procedures become more complex is challenging, and that last-minute arrival of loaner trays also is a problem. “We’re needing a lot more people in SPD than we ever did before to keep up with the load,” she says.
Compared to hospitals, the role of technology in obtaining productivity measures is more limited in the ASC because of cost and, in some cases, not having an EHR. Courtay says Duke was able to negotiate a special price for iQueue for Operating Rooms (LeanTaas), which uses predictive analytics and machine learning to provide information used to manage capacity. The detailed information has helped facilitate her discussions about block utilization with surgeons.
Ziegler-Otis says that even ASCs without an EHR usually have a practice management system for scheduling that leaders can leverage to obtain useful productivity data. “Most scheduling software has the ability to run analytics and data reports,” she says. For example, practice management software typically can track surgeon-specific surgical procedure time and calculate an average case time that can be used to schedule future cases, resulting in effective utilization of a surgeon or group block time. As with any system, data entry must be precise to obtain useful data.

Beverly Kirchner, BSN, RN, CNOR, CASC
Beverly Kirchner, BSN, RN, CNOR, CASC

Becky Ziegler-Otis, MHA, CASC, RHIA, CPHQ, CHC
Becky Ziegler-Otis, MHA, CASC, RHIA, CPHQ, CHC
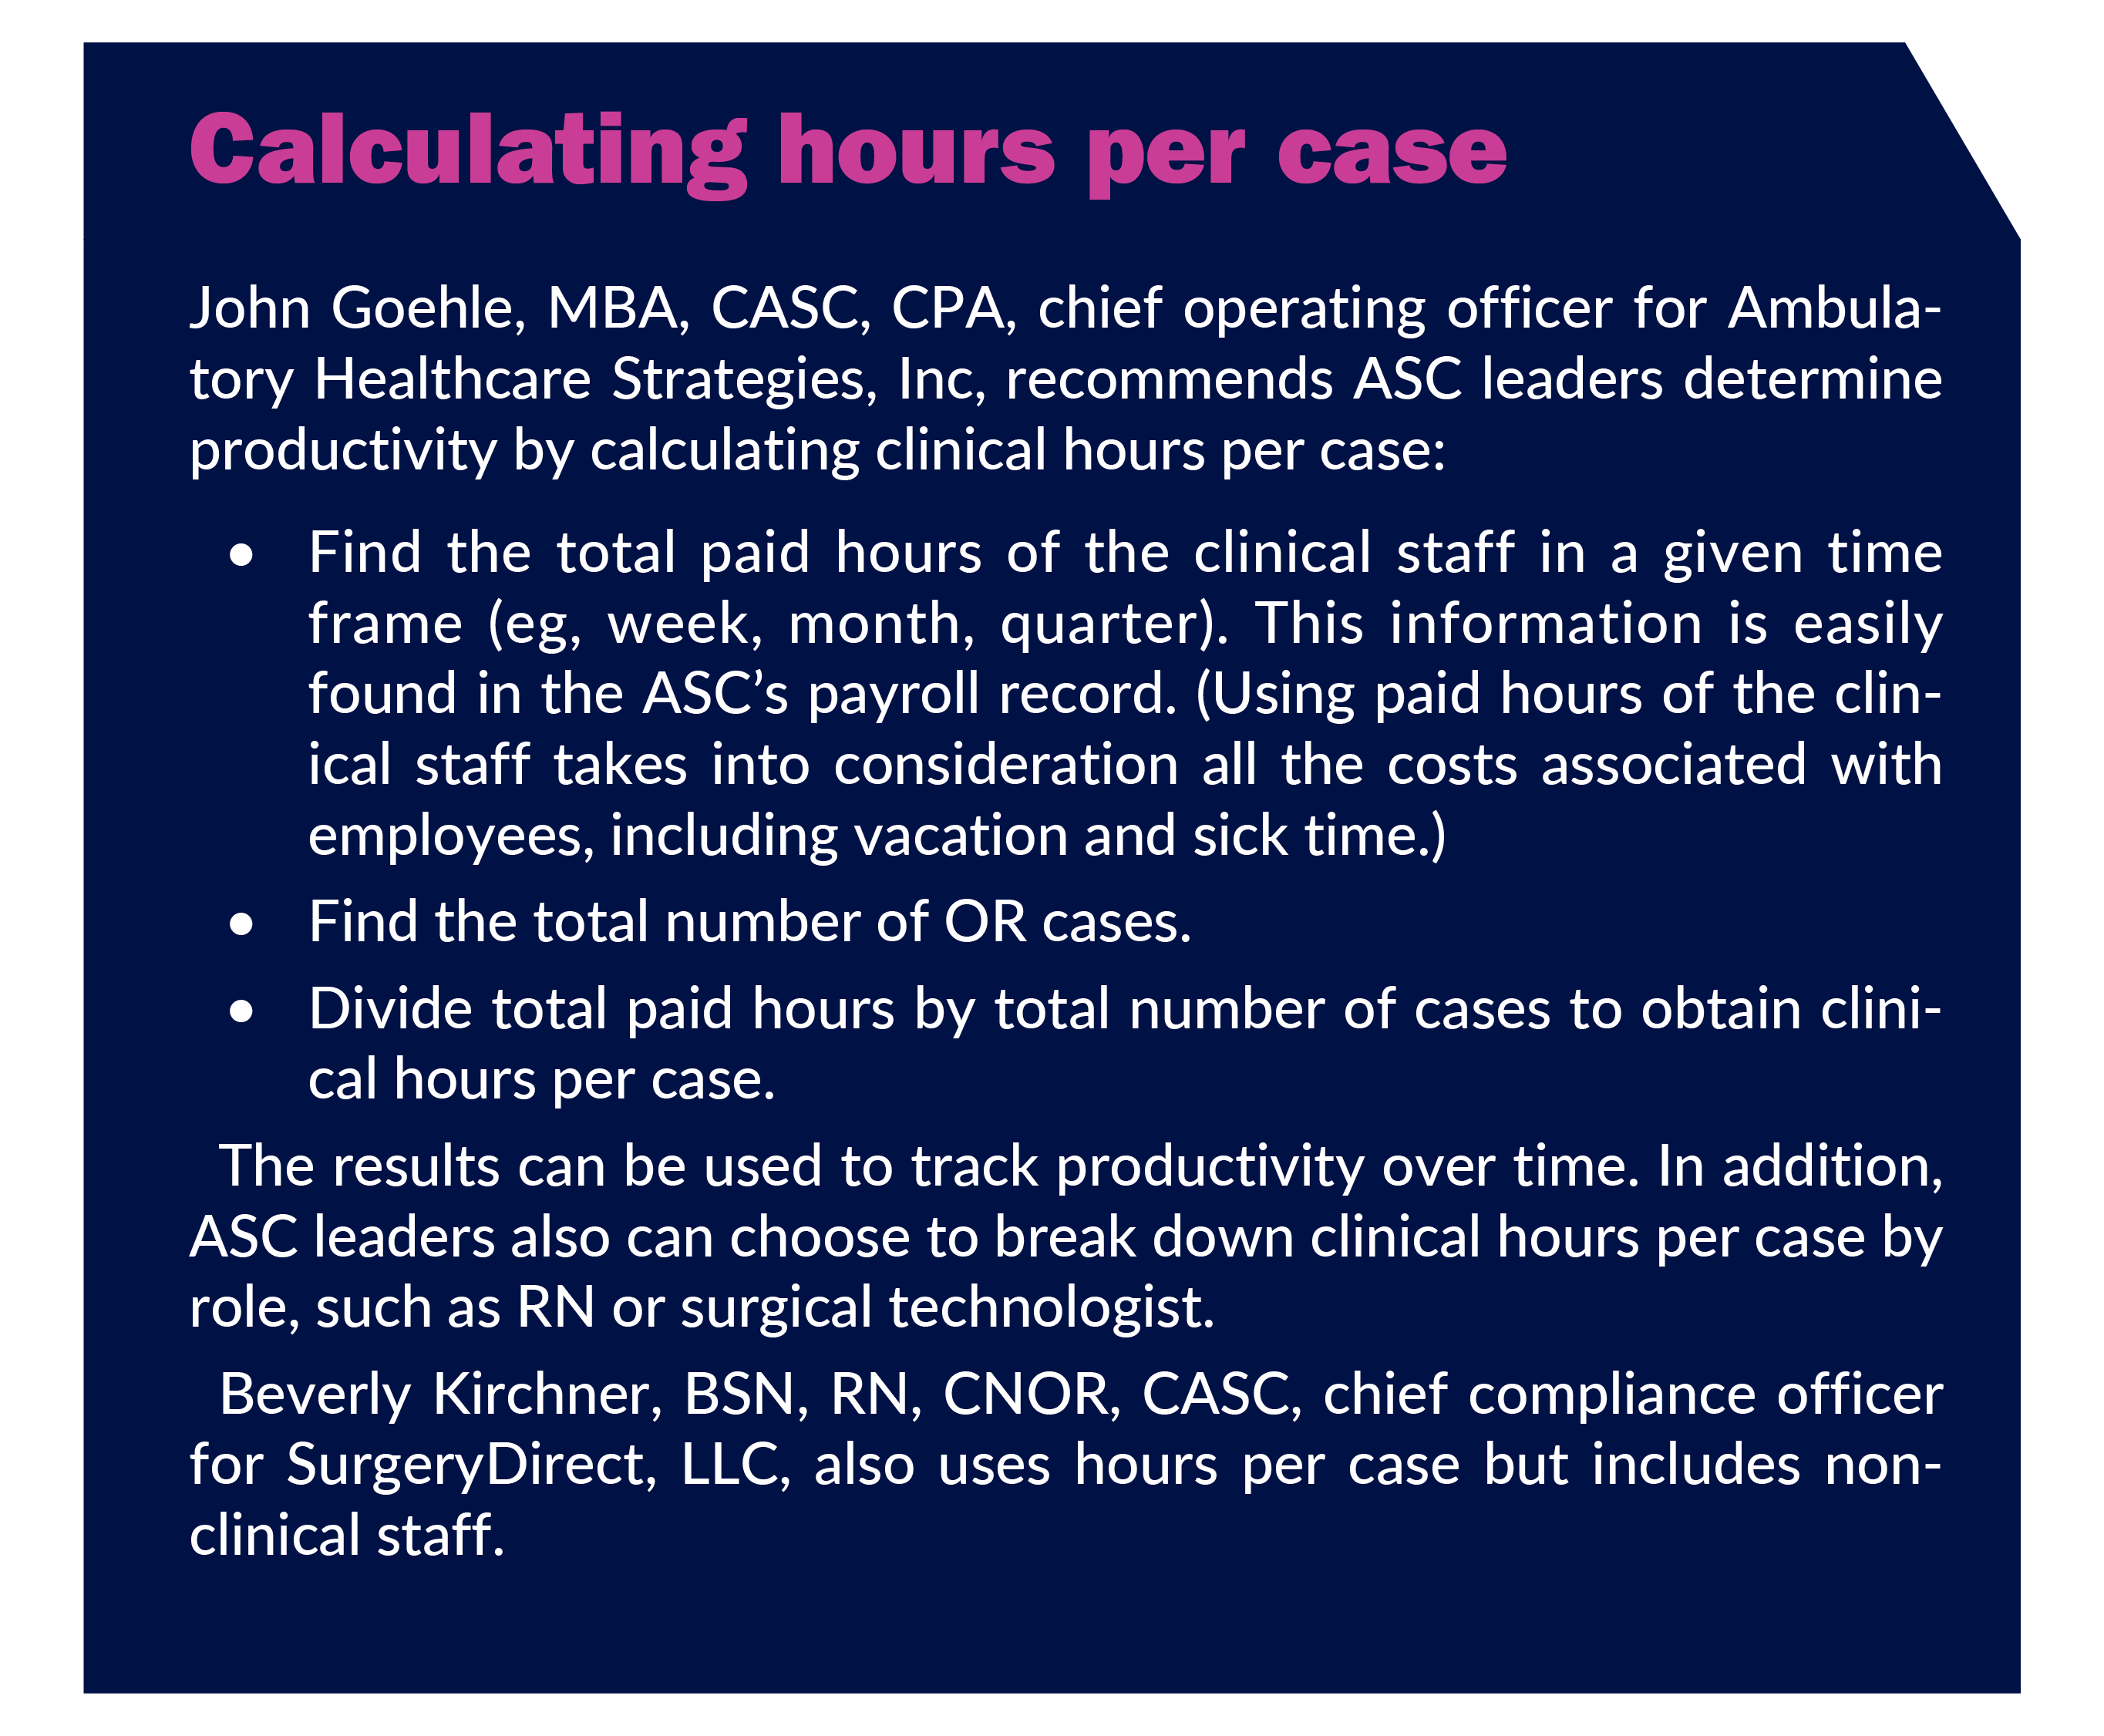

Rena Courtay, MBA, BCN, RN, CASC, CPPM, CNOR(e)
Rena Courtay, MBA, BCN, RN, CASC, CPPM, CNOR(e)
Data analysis
Benchmarking can be a challenge for ASC leaders because few national resources exist. One resource is Intellimarker (VMG Health), which has data for multispecialty ASCs, including revenue, expenses, case volume and mix, payor mix, reimbursement, and staffing. Courtay adds that Becker’s sometimes publishes articles with benchmarking data, and that the ASC management company often sets benchmarks. Another resource is ASCA’s Clinical & Operational Benchmarking Survey (sidebar, Benchmarking resource).
In addition to external sources, ASC leaders can benchmark productivity measures, such as clinical hours per case, against their own performance over time to determine operational efficiency levels. Goehle gives the example of an ASC that has been running at 8 hours per case for the past four quarters but slipped to 7 (a number the center has never seen). In this case, more staff are likely needed, unless staff is complaining about their workload, which may indicate that the center was properly staffed before the decline. “The beauty of this is that you can sell it to the doctors,” Goehle says. For instance, the ASC leader could say, “We’ve never been as low as 7 and staff and patients are complaining; it may be time for us to staff up a bit more.”
Clinical hours per case can serve as an early warning sign for other problems. If, for instance, the number of hours increases from 10 to 13 and staff satisfaction has not changed, an ASC leader would want to examine other possible reasons, such as an increase in delays in first case on-time starts as a result of adding a new surgeon.
A key factor to consider when analyzing data is knowing when to dive deeper into the data. “You have to understand the whole picture,” Kirchner says. “When you break processes down too much, you lose focus of what your end goal is.” For example, if the first case is 15 minutes late, but the time is made up by the end of the day, a leader would not want to criticize staff for the late start.
On the other hand, if overall productivity measures are declining, the ASC leader should look at the process in more detail to identify problem areas. Kirchner cites the example of focusing on preoperative patient preparation. “The preop process drives the ASC’s efficiency,” she says. The centers she works with spend time educating patients and families to improve time to discharge and establish parameters for what is needed before each case. For instance, patients who will undergo complex spine procedures must have a full history and physical at least 7 days pre-surgery, or the case gets cancelled.
After making a change, Ziegler-Otis says ASC leaders should continue monitoring to ensure the change had the desired impact. For example, a leader might implement 10-hour shifts as a staff satisfier and to improve productivity, only to discover that staff do not support the change and productivity does not improve; unintended staff turnover could occur as a result. In addition, solutions should be tailored to the ASC’s need. “What works at one center doesn’t necessarily work at another,” she says. “Each ASC is unique, so you might have to tweak things based on your needs.”
Communicating effectively
The results of productivity measures should be shared with the ASC’s board and staff. Kirchner says boards usually comprise mostly surgeons (who also may be owners), often making communication easier for ASC leaders compared to their hospital counterparts. “Surgeons understand productivity because it hits them in the wallet,” she says. “The more productive we are, the more money they make.”
When meeting with owners and boards, Ziegler-Otis recommends ASC leaders always include labor and supply costs as a percentage of revenue. Discussing these and other productivity measures regularly helps foster buy-in when the leader needs additional staff or to make changes to improve efficiency. One example is when labor costs go up, but block time utilization goes down (the target is usually 75%). “A leader could then work with surgeons to compress the schedule and use block time more effectively to ensure cases flow as efficiently as possible,” Ziegler-Otis says.
Communicating productivity results can help with planning for the future. Courtay keeps a spreadsheet that includes daily case volume and staff for the preoperative area, OR, and PACU in each ASC in the Duke Health System and uses this simple tool to show senior leadership the scope of what is needed. “I can explain it to the CEO of the hospital, and he gets it,” she says. Courtay recently used the spreadsheet to help her obtain approval for needed positions. “We were able to show that we are already below where we are supposed to be for staffing,” she says. Leaders at each ASC setting also use the tool to help determine daily staffing needs. “It holds them accountable for maximizing productivity.”
Productivity and staffing
Staff productivity depends on having staff work to the top of their license. “You don’t have nurses doing things like cleaning or pulling cases that lower-paid positions could do,” Courtay says. She adds that Duke has an advantage in that it can shift staff from one ASC to another to optimize productivity at each location.
Courtay says ASC leaders should not establish staffing levels based on peak volume, but rather focus on minimum requirements, then use per diem staff to supplement as needed. This strategy helps avoid needing to send staff home because of low volume.
Staff sometimes feel pressured to increase their productivity, believing they already have too much work. They may even say patient safety is at risk. In this case, Courtay focuses on whether standards are being met. If they are, it helps take the emotion out of the discussion. For staff who complain about being required to go to other ASCs when census is low, Courtay frames it as a way to help staff get their hours.
“The best way to boost productivity is to make your employees happy,” Goehle says. “You want to make sure people are totally trained for the position, that they’re properly mentored, and that they’re given the proper amount of time to acclimate to the job.” He recommends ASC leaders have new staff meet with those working in other areas. For instance, an OR nurse should spend time in PACU. In addition to building relationships, “they might see things that no one else noticed but could be changed to improve care and productivity,” Goehle says. It can be difficult to invest in onboarding time when staff shortages exist, but doing so will reduce staff turnover and ultimately save the center money.
Keeping employees happy depends on maintaining a positive culture, Courtay says. “You want to explain why you are doing things, how they can be a part of it, and get their ideas about how things can work better.” She adds that ongoing recognition is key, “They want to hear ‘thank you’ and know that what they’re doing is appreciated.”
A positive culture includes positioning productivity as a positive force. “Try to have staff look at productivity in a positive way,” Ziegler-Otis says. Leaders can work with staff to identify ways to change work processes so they are more productive but also are doing the clinical work they are trained for, rather than less satisfying work that others or technology can do. Listening to staff’s ideas and concerns is key. For example, if staff are concerned about an added task, leaders can work with them to see if there are other activities that could be eliminated, such as those that are only being done because of tradition but are hindering productivity.
Ziegler-Otis adds that to maintain efficiency, leaders need to address staff issues promptly to avoid a drop in morale. “The efficiency of an organization is directly related to the morale of employees,” she says. “If an employee is behaving inappropriately or causing team issues, it’s important to address the issue, work through it in a timely manner, and not let it persist.”
Here to stay
“With value-based care moving into the ASC, productivity is going to become more and more important to us,” Kirchner says. By keeping measures simple and using data to make thoughtful changes, ASC leaders can enhance the success of their centers. “The metrics can help you think through ways to be a more effective leader and to enable your staff to be more effective as well,” Ziegler-Otis says.
—Cynthia Saver, MS, RN, is president of CLS Development, Columbia, Maryland, which provides editorial services to healthcare publications.


